Context & problem
An overhead condenser receives the vapor mixture from the top of the column and has to condense it evenly across
the whole tube bundle. When the distribution header is uneven, some tube rows take more flow than the rest: the
actual condensing capacity falls below design, and the starved rows become dead zones.
Corrosive vapor lingers longest in dead zones and bypass flow; local corrosion there determines the retubing interval of the entire unit. Inlet–outlet operating data cannot reveal either phenomenon, because they give only overall values.
Approach
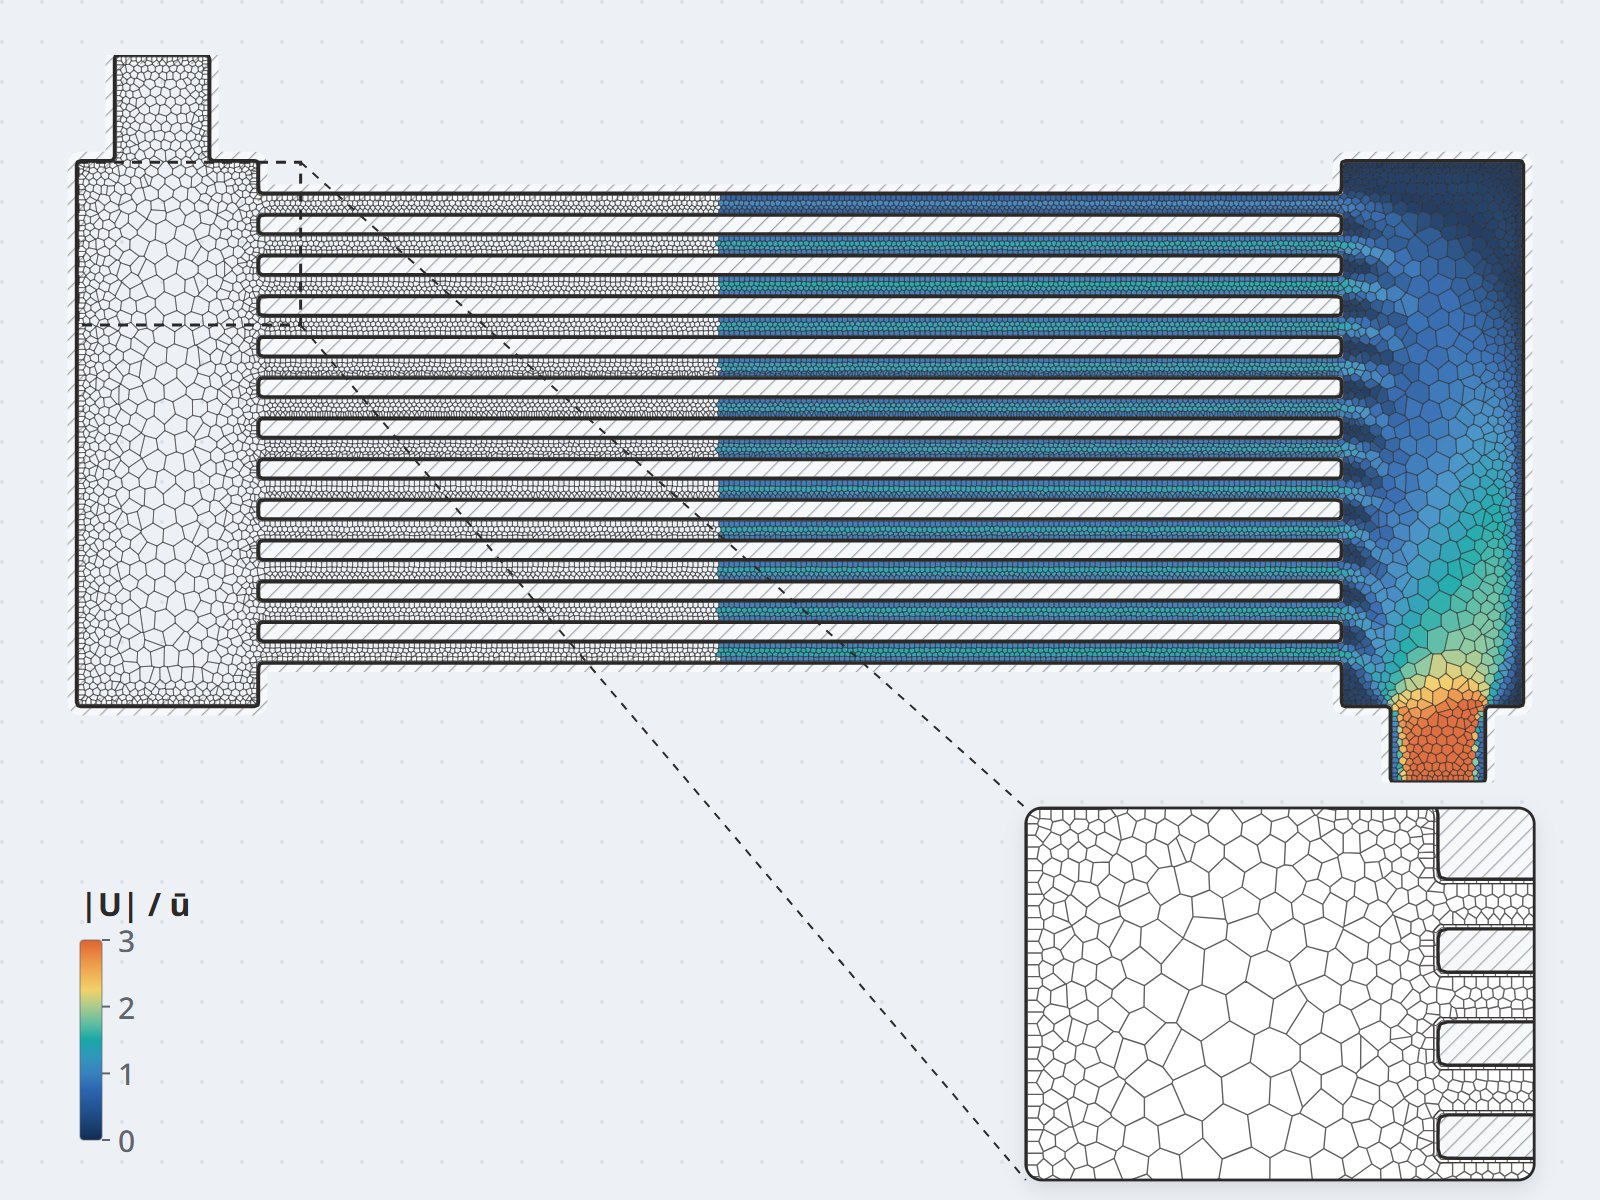
- A continuous scope from header to tube bundle: the model covers the whole distribution path, so the
distribution into each tube row is a result of the simulation rather than an assumption fed into it.
- Multiphase evaporation – condensation: a phase change model inside the tube bundle so that condensing
capacity and liquid distribution reflect the real process, instead of being computed as single-phase flow.
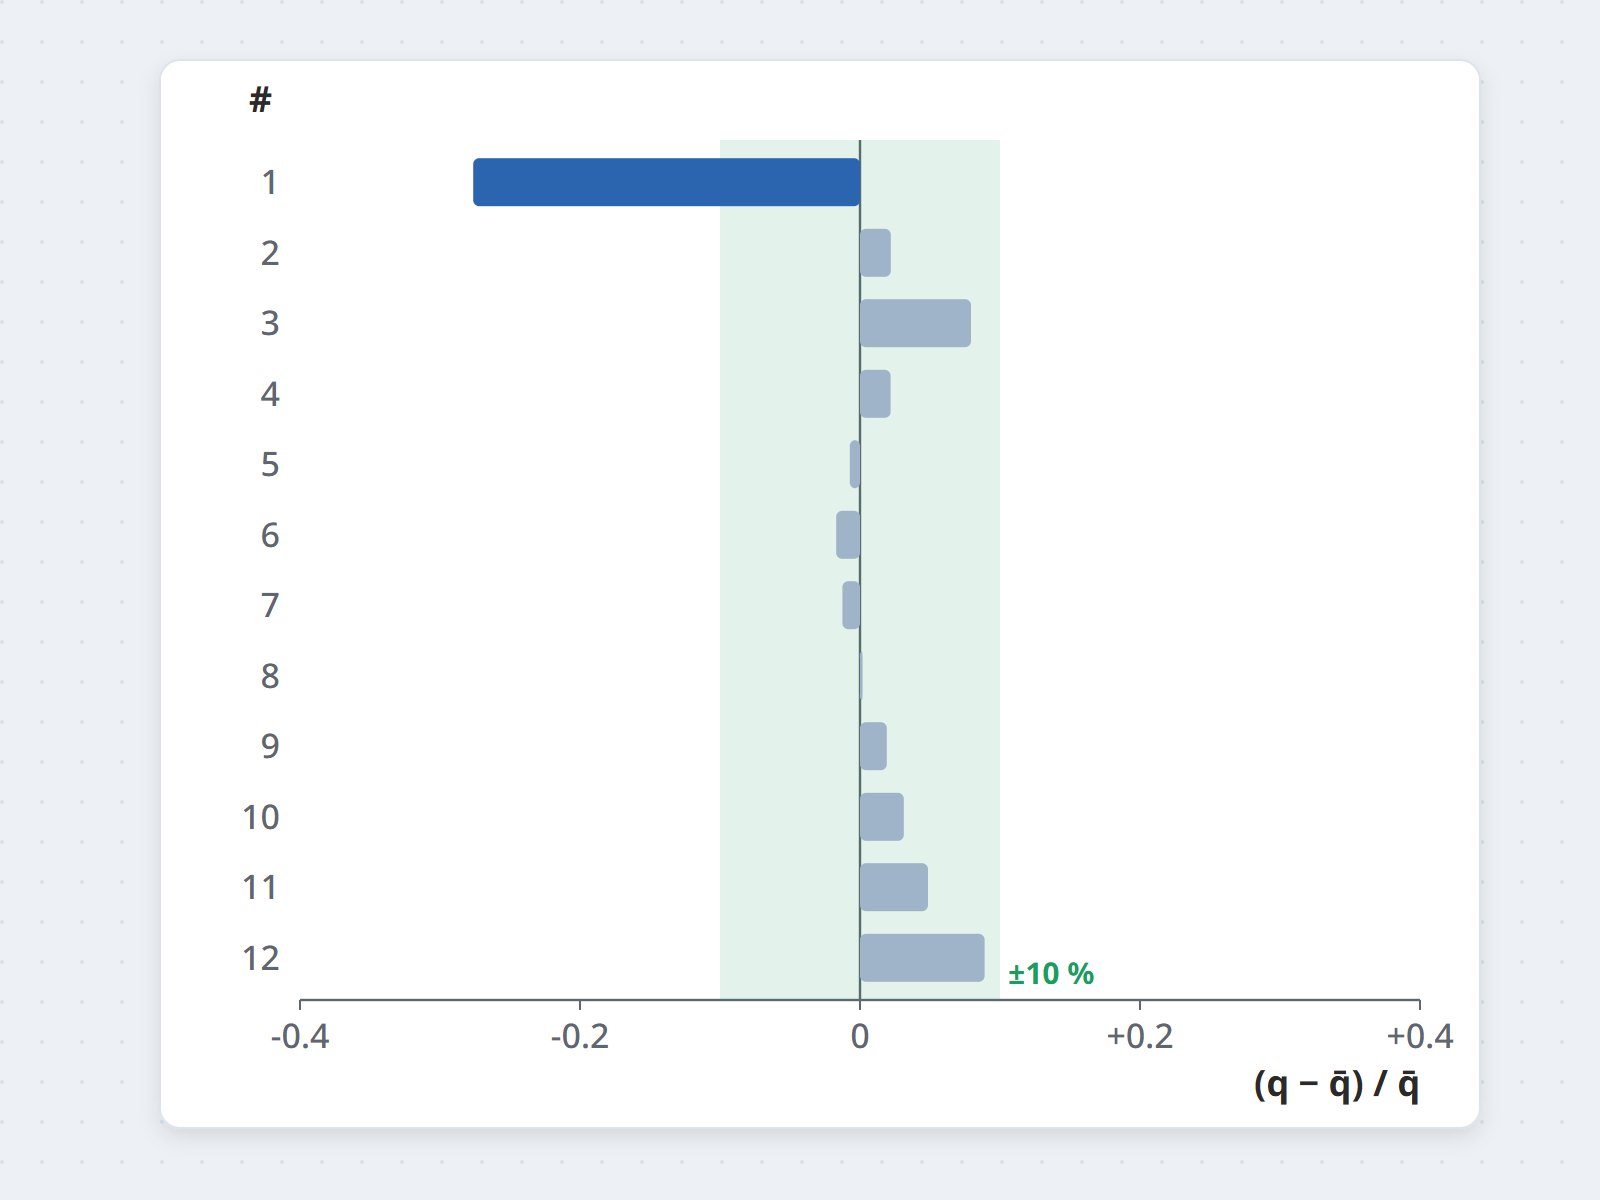
- Maldistribution diagnosis: quantifying how far each tube row deviates from design, ranking which rows
take too much and which too little.
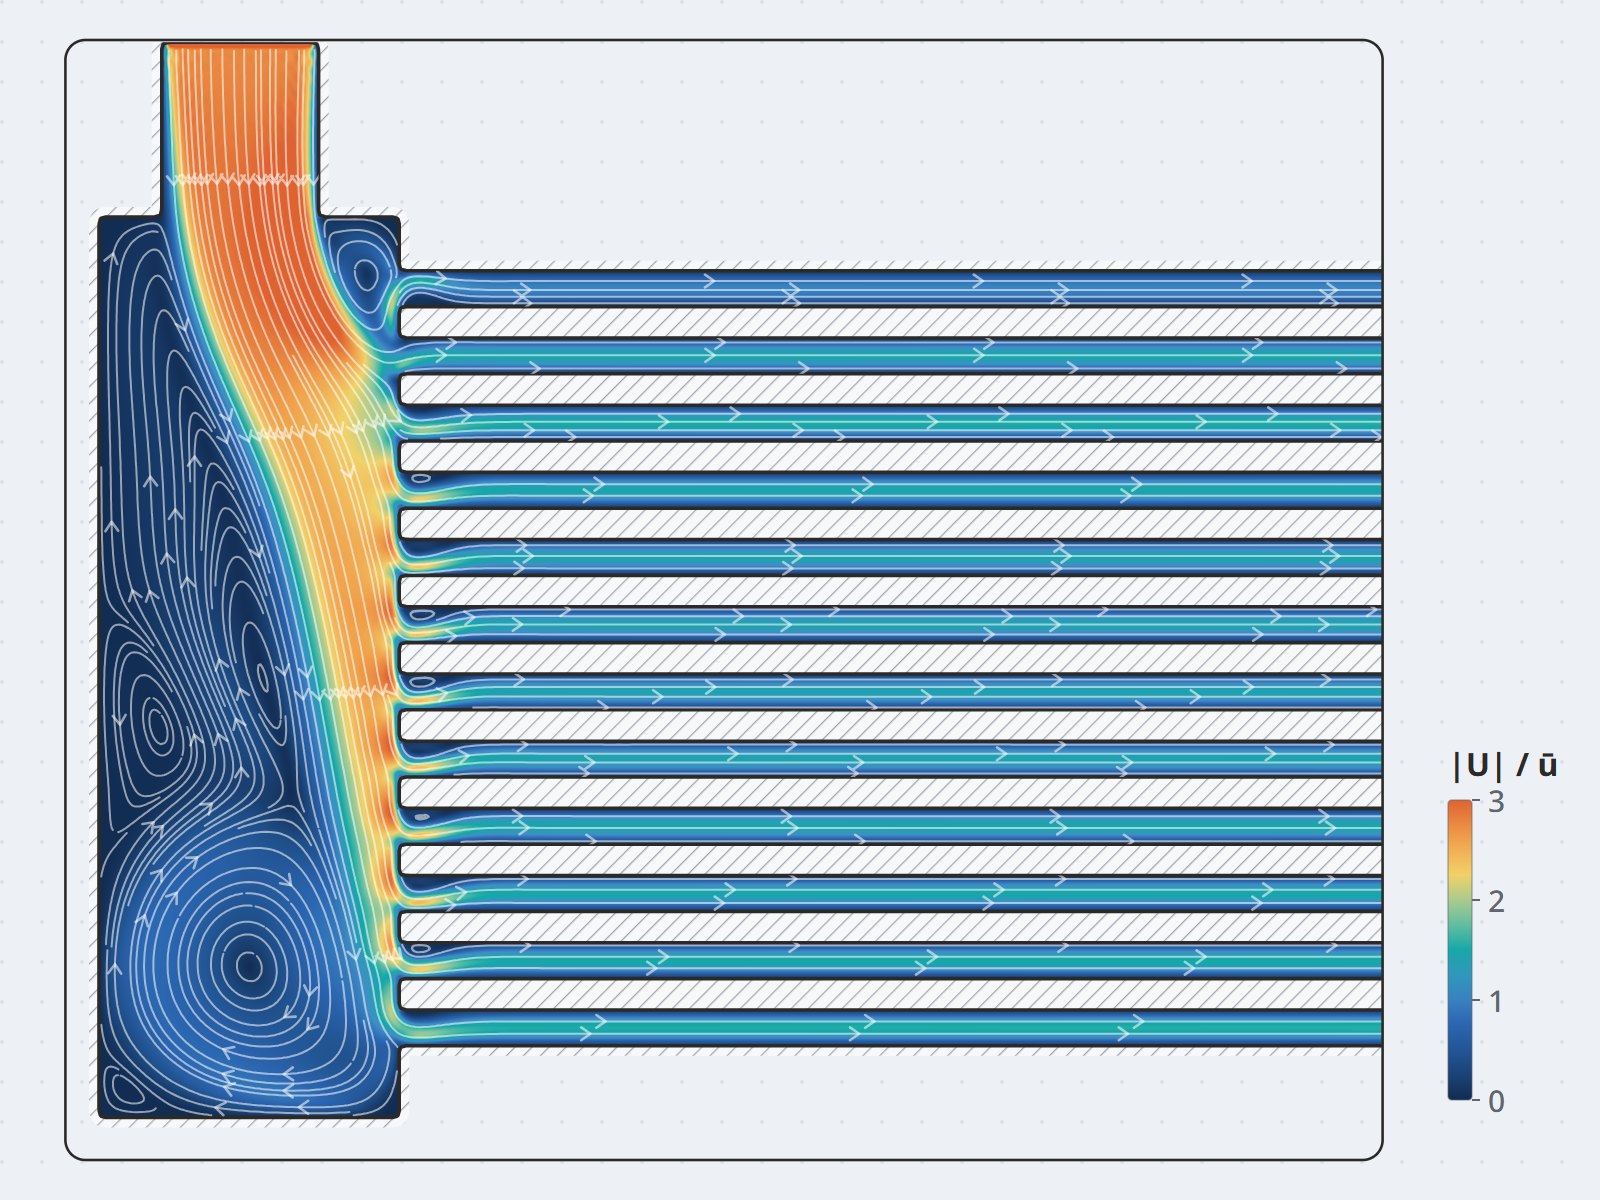
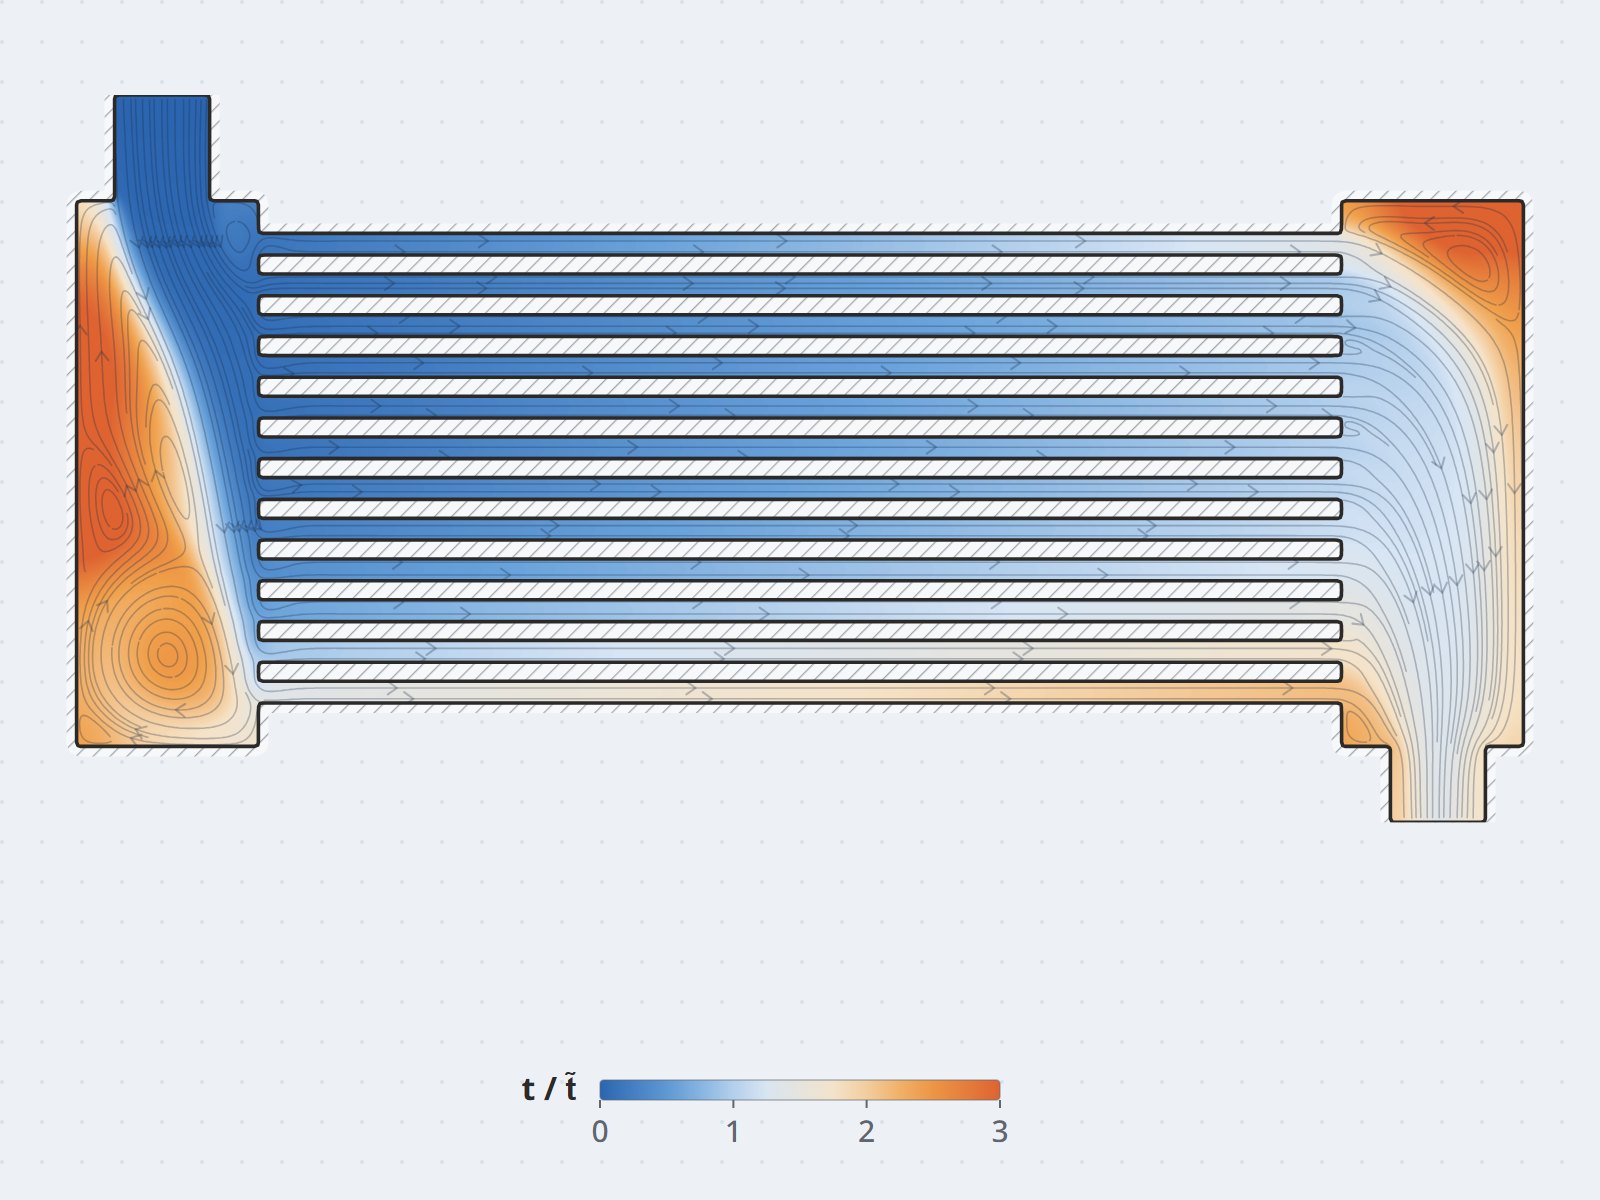
- A risk map: locating dead zones, bypass flow and areas where liquid pools — cross-checked against the
corrosion locations recorded in the maintenance history.
Results
- The flow deviation of each tube row against design was quantified — the basis for explaining the gap
between actual and design condensing capacity.
- Dead zones and pooling areas were located on the real geometry, matching the corrosion positions recorded in the
maintenance history.
- A distribution correction was assessed on the same model before it entered the retrofit plan.
Value
Instead of retubing on a schedule and accepting below-design capacity as inevitable, the plant now has a map of causes: where the maldistribution occurs, how large it is, and where correction is most effective.