
CFD simulation is transforming industry generally and HVAC in particular [source]. The previous article covered where CFD is used in HVAC and the value it brings. One of those applications is assessing thermal comfort inside buildings. This article covers:
- What is thermal comfort?
- The role of CFD in assessing it.
- An application: CFD assessment of indoor thermal comfort.
What is thermal comfort?
Under TCVN 7438, thermal comfort is defined as the condition of mind that expresses satisfaction with the thermal environment (the air surrounding the body at a given temperature). Put simply: a person does not feel too cold in a cool environment or too hot in a warm one.
Thermal comfort depends on the balance between two basic groups of factors: the person and the environment. The environmental factors can be adjusted by the building's HVAC controls: (1) air temperature, (2) radiant temperature, (3) air velocity and (4) air humidity. The personal factors relate largely to activity level: (5) metabolic heat (generated by movement and metabolism) and (6) clothing insulation.
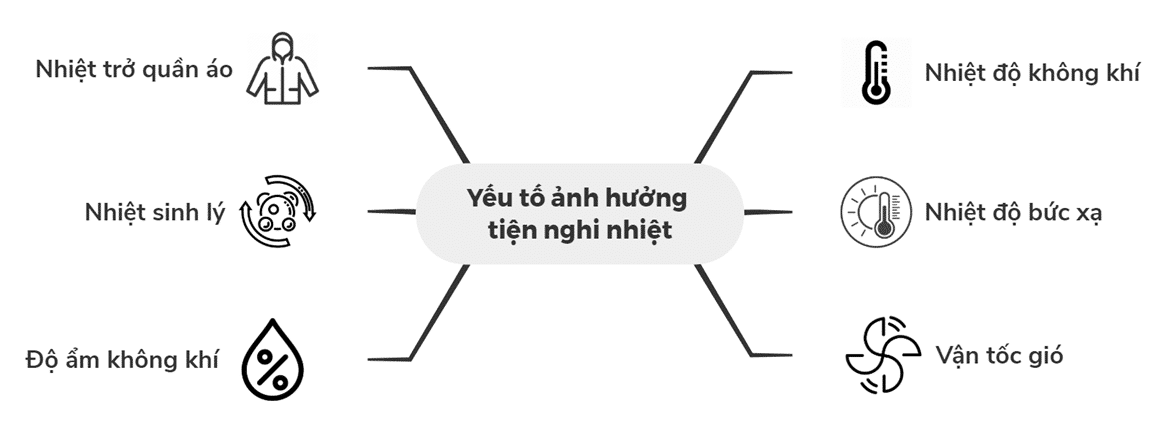
The personal and environmental factors that affect thermal comfort
Because those factors act together, assessing comfort through isolated numbers such as air temperature or air velocity rarely reflects how comfortable people actually feel. Standards such as ASHRAE 55 (USA), ISO 7730 (international) and TCVN 7438 (Vietnam) therefore define indices that capture the combined effect of the environment on people. For green buildings, thermal comfort is covered by standards such as LEED (USA) and Green Star (New Zealand). Some of the indices used:
- Predicted Mean Vote (PMV): predicts the mean vote of a large group of people on a 7-point thermal sensation scale (see the figure below). The standard range for PMV is ± 0.5.
- Predicted Percentage of Dissatisfied (PPD): predicts the percentage of a large group exposed to the same environment who will be dissatisfied. The standard requires PPD below 10%.
- Draft Rating index (DR): unwanted local cooling of the body caused by air movement, expressed as the percentage of people dissatisfied because of it. The standard requires DR below 15%.
- Effective Draft Temperature (EDT): the temperature difference between the air moving near the body and the surrounding environment. The standard range for EDT is −3 °F to +2 °F.
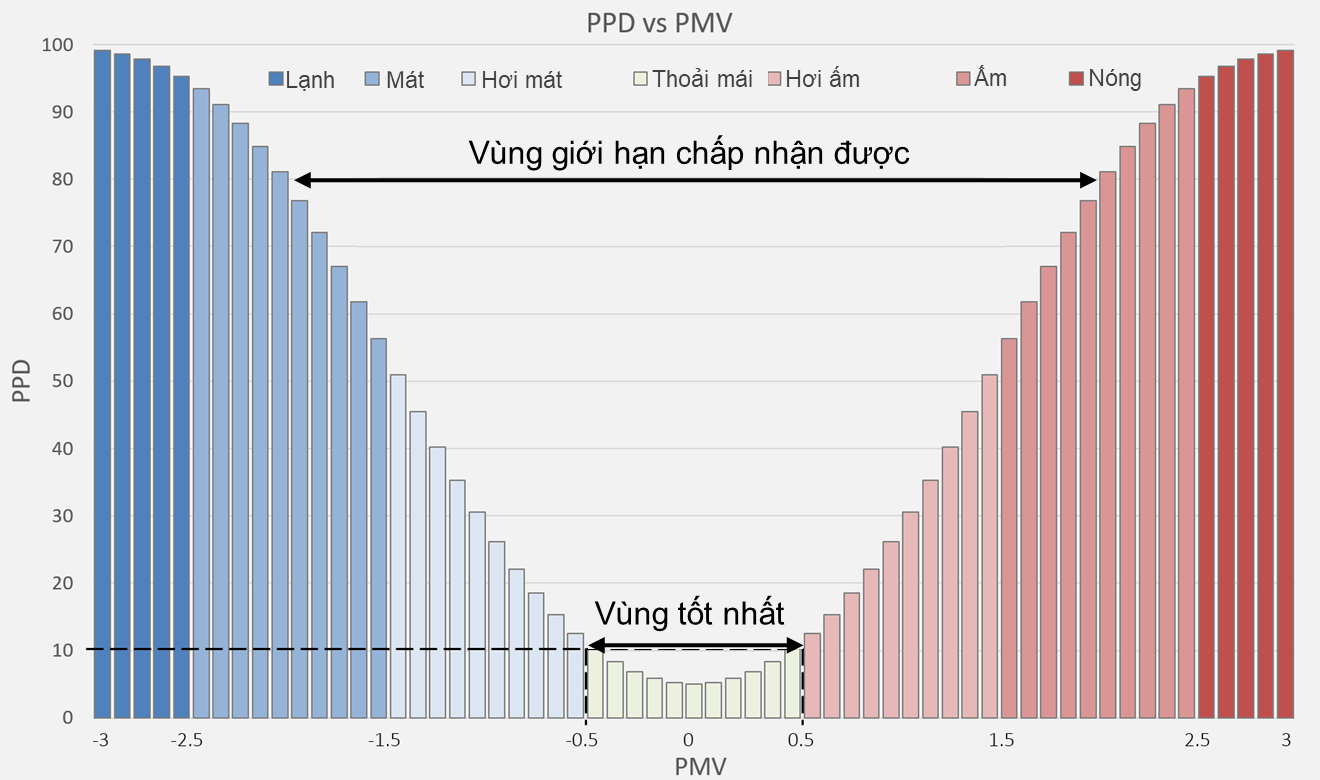
The PMV and PPD thermal comfort indices on the 7-point thermal sensation scale. [source]
The role of CFD in assessing thermal comfort
Most mathematical models in the thermal comfort standards are empirical: built from field statistics combined with simplifying assumptions, and used to compute average comfort indices. In reality many factors make thermal comfort vary in both space and time. Comfort models are therefore integrated into the CFD workflow as shown below, with these benefits:
- Straightforward verification of the computed comfort indices and of the original design (keeping physical testing to a minimum).
- Easy assessment of how environmental factors act together on the comfort indices (both average and local) in any building, so design and sustainability requirements (green building criteria) can be met.
- A convenient way to establish how much energy the HVAC system saves.
- Optimization of the HVAC system, the control system (IoT) and the furniture layout.
- A competitive advantage for design contractors.
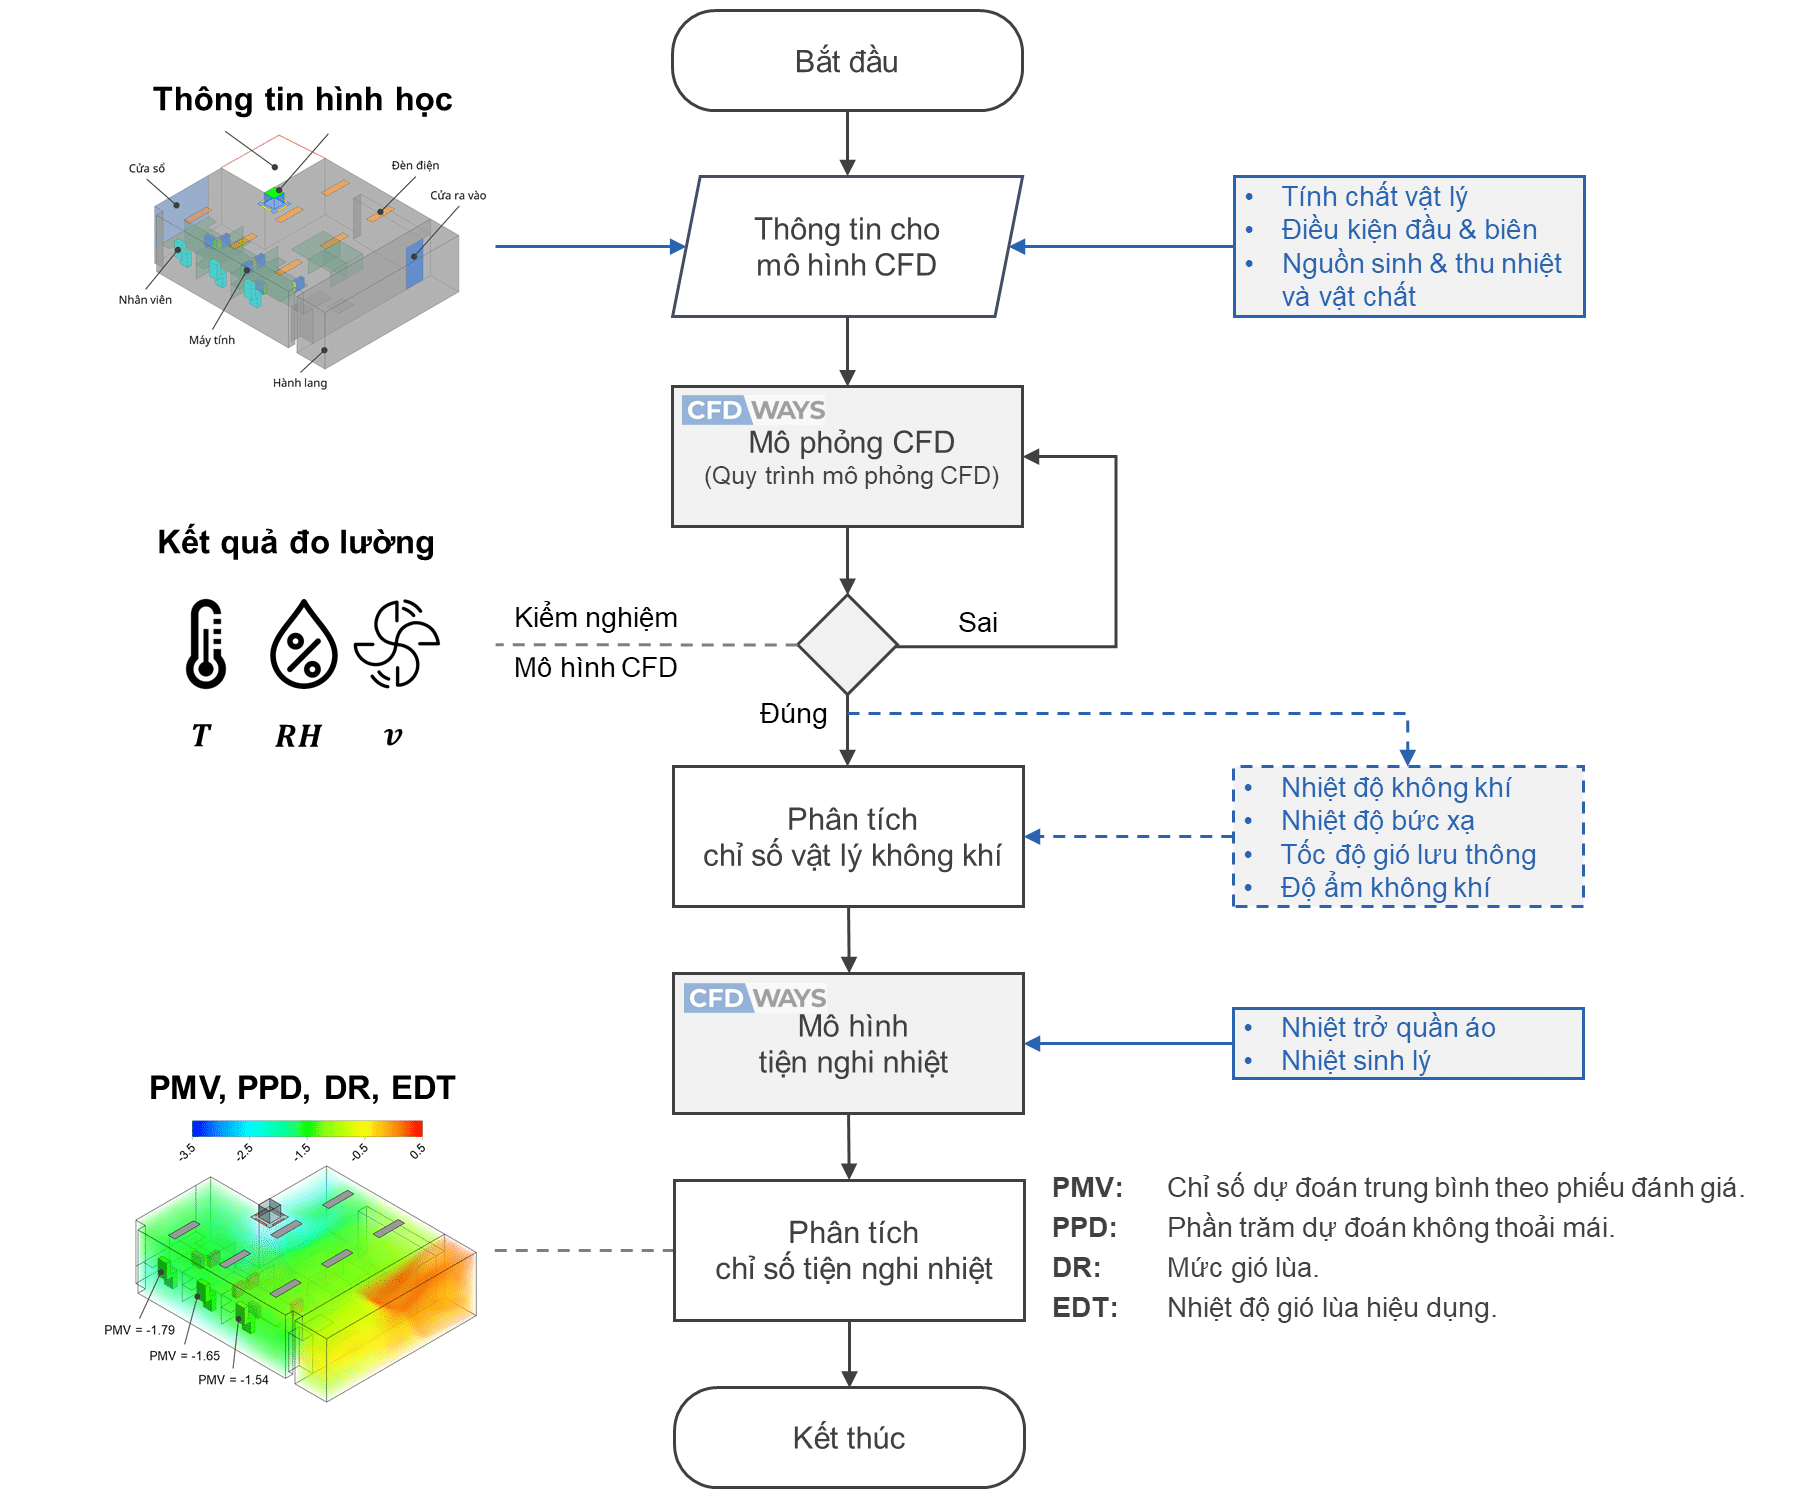
The workflow combining CFD with thermal comfort assessment
CFD assessment of indoor thermal comfort
To create a thermally comfortable indoor environment, engineers must control the air flow rate and velocity appropriately, keep the temperature stable and minimize drafts [source]. CFD shows the distribution of the comfort indices clearly, so engineers can study the problem in detail and arrive at an effective solution. The following simulation makes the benefits concrete.
The simulated case
The simulated space is an office with an operating HVAC system, containing both heat sources (mainly the occupants, the computers and the lighting) and heat sinks (mainly heat lost through the gap around the door).
The simulation runs with these fixed conditions:
- The temperature outside the office is 30 ºC.
- The initial temperature inside the office is 30 ºC.
- The ceiling-mounted air conditioner runs at full capacity, with an air velocity of 3 m/s at 20 ºC.
- The heat flux from people is 55 W/m2 and from the lighting 18 W/m2.
- Each computer dissipates 100 W.
- The windows are closed and sealed; the door is closed with a 1 cm gap at the floor.
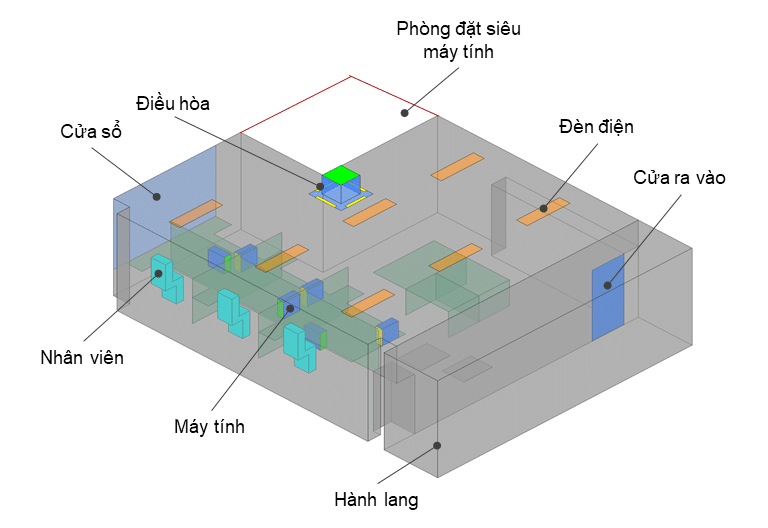
The 3D CAD model of the office
Simulation results
With the air conditioner at full capacity, the results (below) show the comfort indices (PMV and PPD) around the occupants rising steadily from the outer side (near the corridor) toward the inner side (near the windows). They still lie within the acceptable comfort range (−2 ≤ PMV ≤ +2 under TCVN 7438). In practice the occupants would control the system to keep PMV within ± 0.5 (equivalent to PPD < 10%) as the standards require (TCVN 7438 or ASHRAE 55) for the most comfortable conditions. Away from the human body, PMV and PPD only indicate the trend in comfort that would be felt if someone were there. The space directly beneath the air conditioner is the least comfortable. PMV is largely negative, showing the unit has more capacity than needed to remove the heat generated in the room.
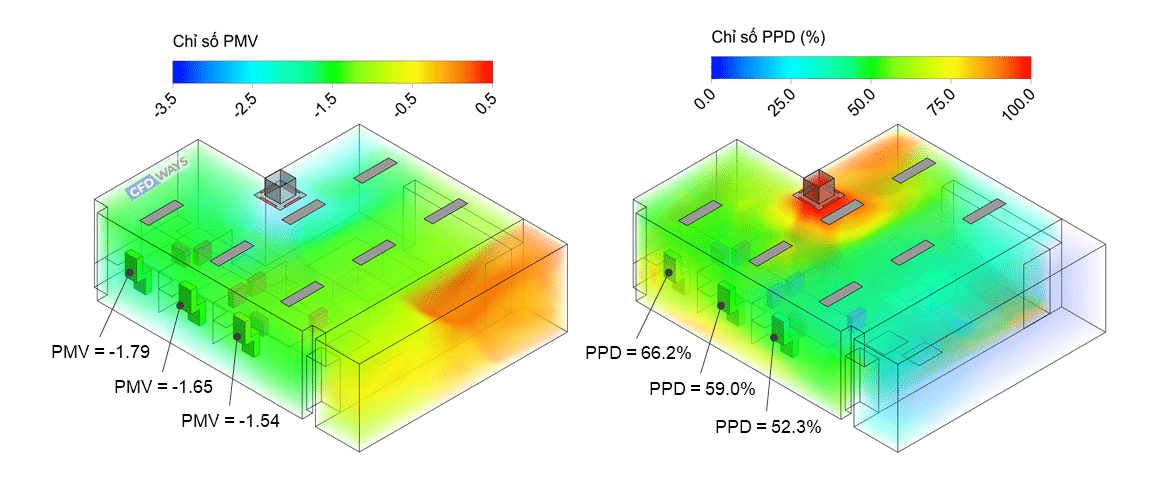
PMV and PPD distribution in the office after 80 minutes of cooling
(PMV = 0 marks the highest level of satisfaction)
The temperature difference with height caused by radiation and natural convection creates air movement around the body. Together with the forced convection from the air conditioner, that movement (draft) can cause discomfort. The DR and EDT indices are therefore used to assess draft around the occupants. The figure below shows that the draft acting on the two people on the outer side is similar. The third person is harder to judge: a higher DR suggests more dissatisfaction, while an EDT close to 0 suggests more satisfaction. Even so, with the unit at full capacity, DR and EDT both meet the standards (DR < 15% under TCVN 7438, −3 °F < EDT < +2 °F under ASHRAE 55). Away from the body, these indices again only indicate the trend in how satisfied a person would be.
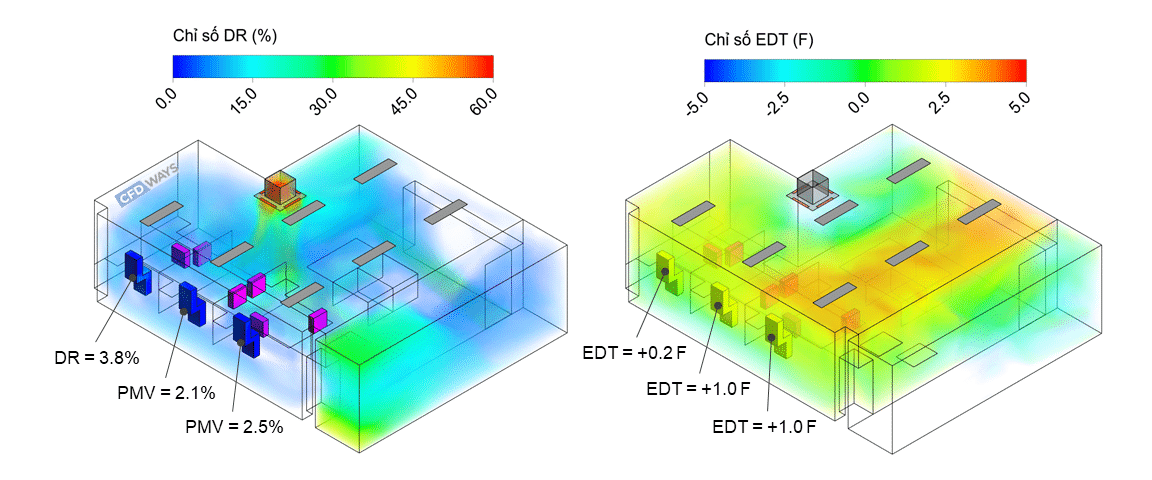
DR and EDT distribution in the office after 80 minutes of cooling
(EDT = 0 marks the highest level of satisfaction)
Conclusions from the simulation
Taken together, the comfort indices show discomfort rising from the outer side inwards, and the occupants on the far side tending toward dissatisfaction with the thermal environment. The simulation shows how much easier comfort assessment becomes once the indices are visualized. Based on their distribution, several improvements can be proposed so that everyone is thermally comfortable:
- Changing the angle of the air deflector vanes.
- Changing where the air conditioner is mounted.
These options are verified by re-running the comfort simulation and comparing the results. The same approach optimizes the HVAC system and determines its optimal operating conditions.
Conclusion: CFD is an effective tool for assessing thermal comfort in HVAC
Assessing and optimizing thermal comfort so the indoor environment is as comfortable as possible becomes far easier when CFD simulation is part of the HVAC design calculation. Comfort simulation saves time, cost and operating energy while raising the comfort standard achieved, helping the building meet green building criteria and move toward sustainability.
Follow the next part on assessing air quality in the series “CFD simulation in the HVAC field” on the CFDWAYS Blog.