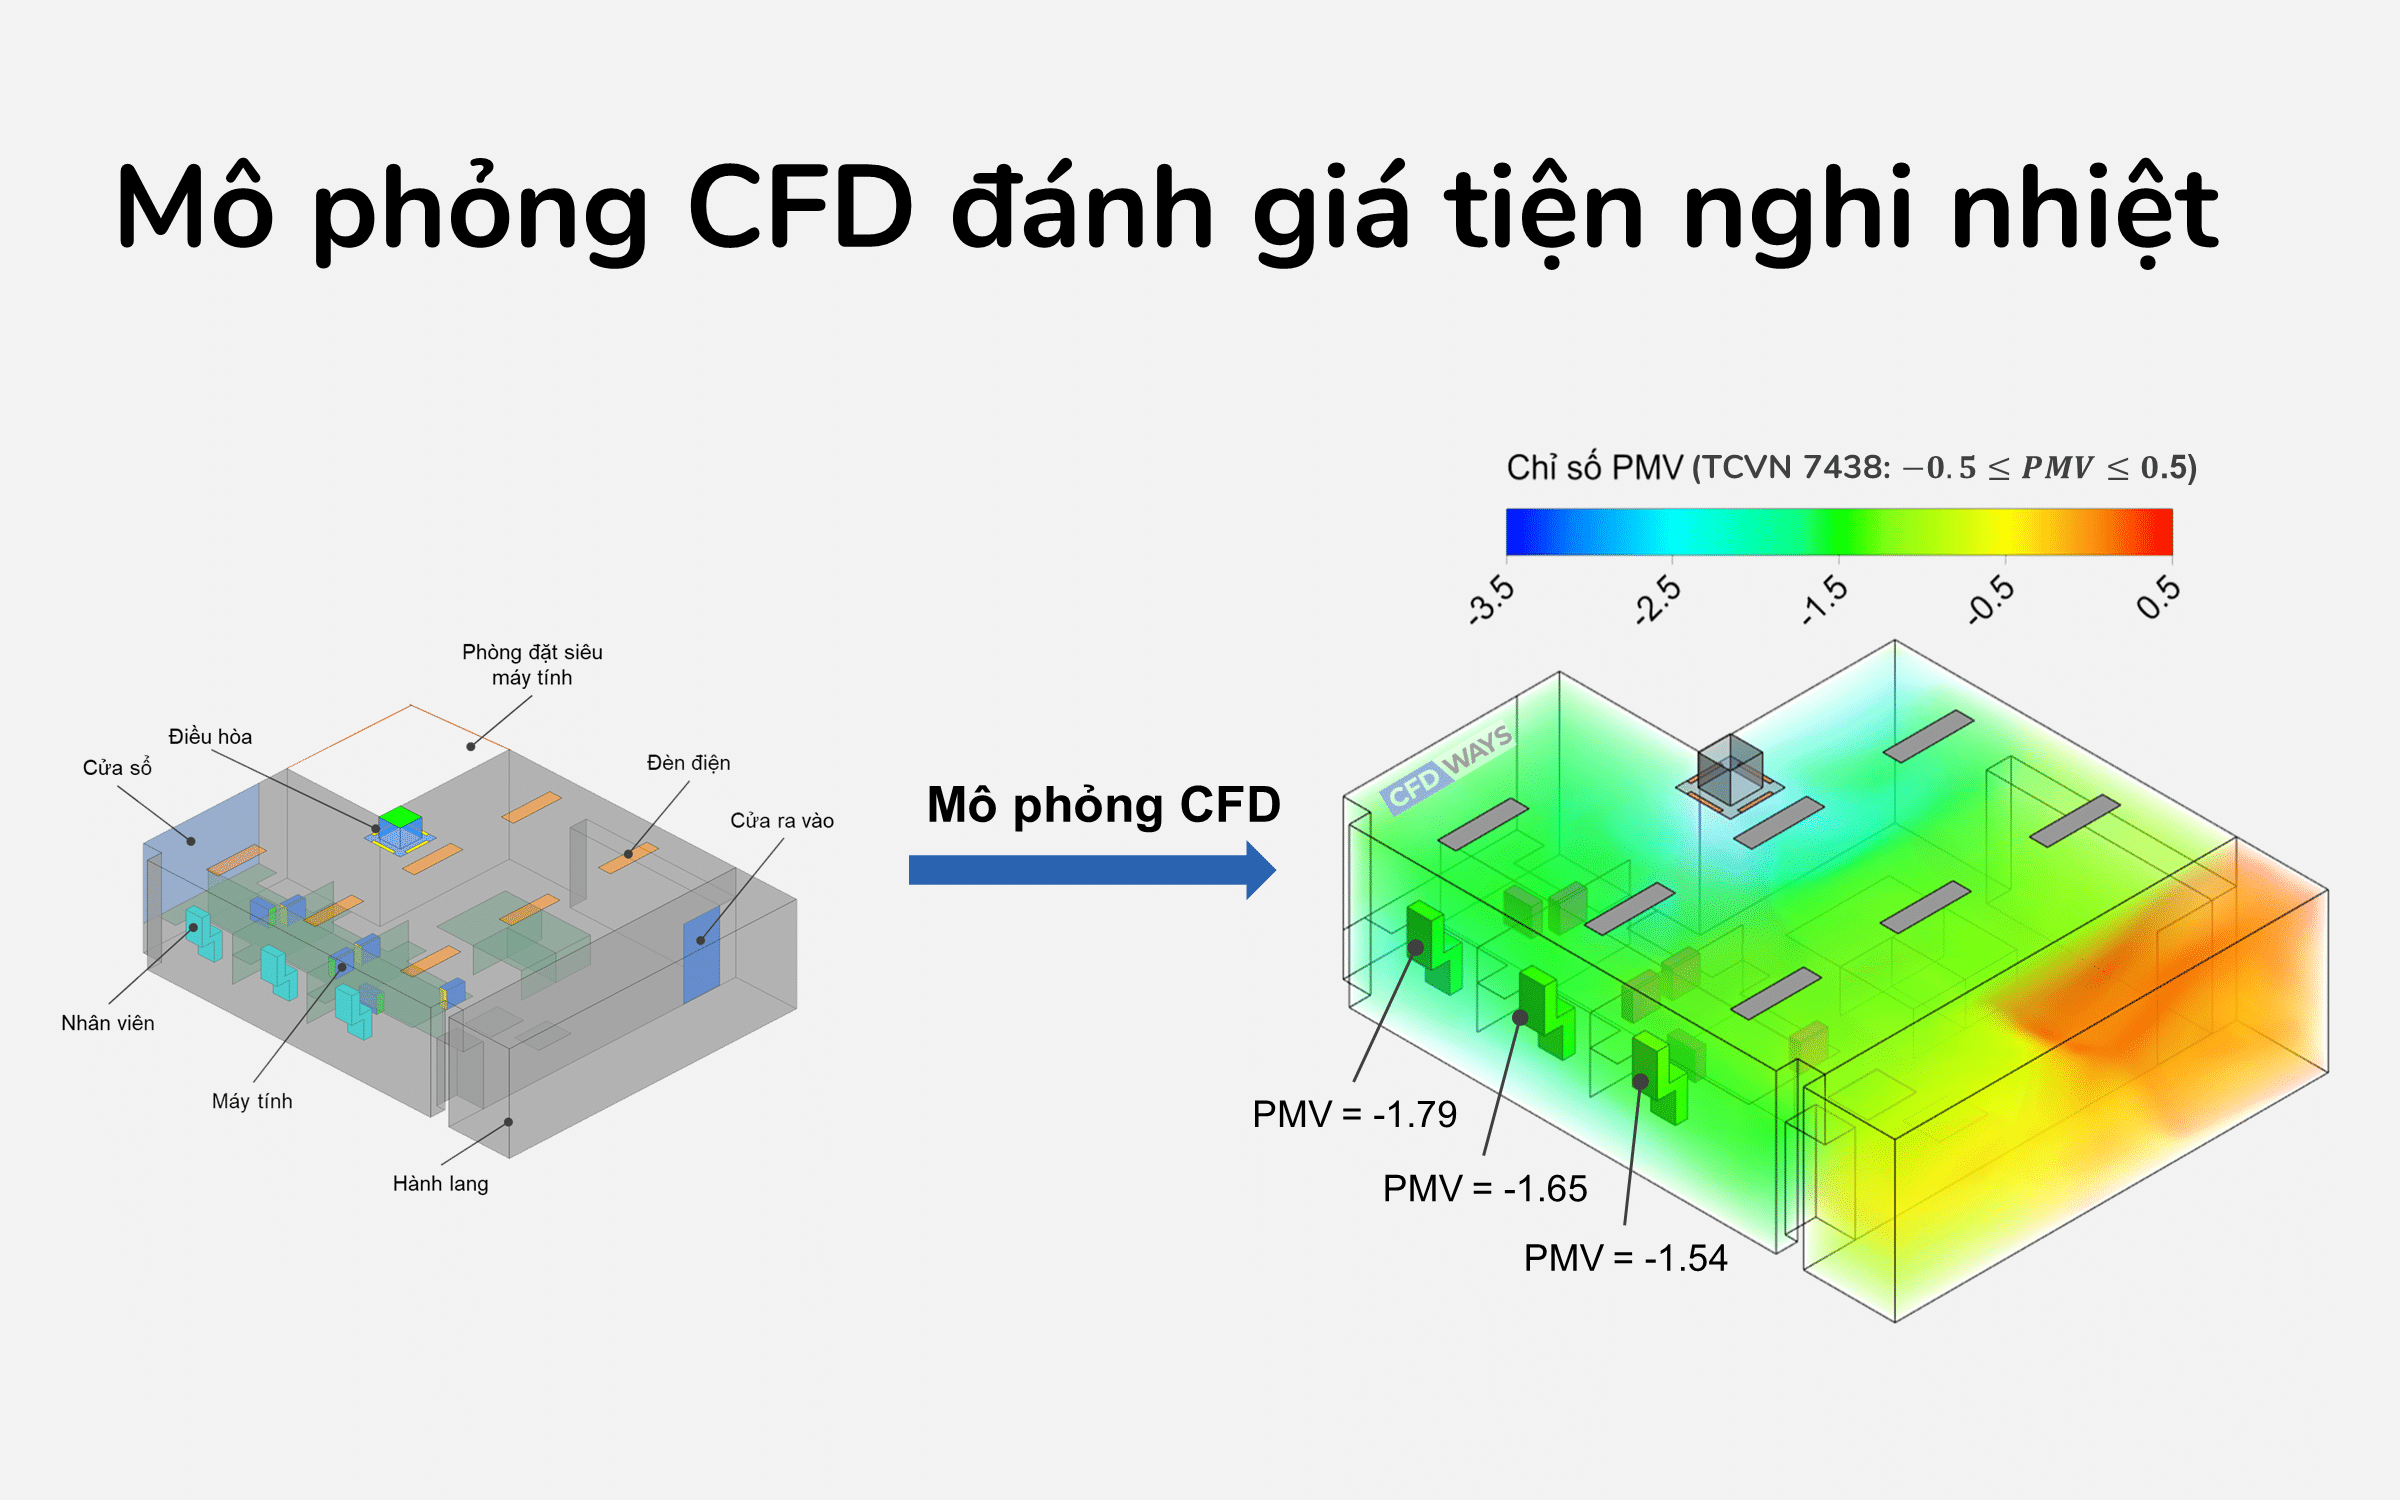

In the previous article we looked at using CFD to assess thermal comfort. The next part of the series “CFD simulation in the HVAC field” is CFD applied to air quality. In this article we look at:
- What is indoor air quality?
- The role of CFD in assessing it.
- An application: CFD assessment of indoor air quality.
What is indoor air quality?
Indoor Air Quality (IAQ) refers to the quality of the air inside and around buildings and structures [source]. It affects the health and comfort of the people inside. The main factors are the pollutants themselves: (1) carbon dioxide (CO2), (2) carbon monoxide (CO), (3) sulfur dioxide (SO2), (4) nitrogen dioxide (NO2), (5) ozone (O3), (6) particulate matter (PM2.5 and PM10), (7) volatile organic compounds (VOCs), and (8) micro-organisms (viruses, mold and so on).
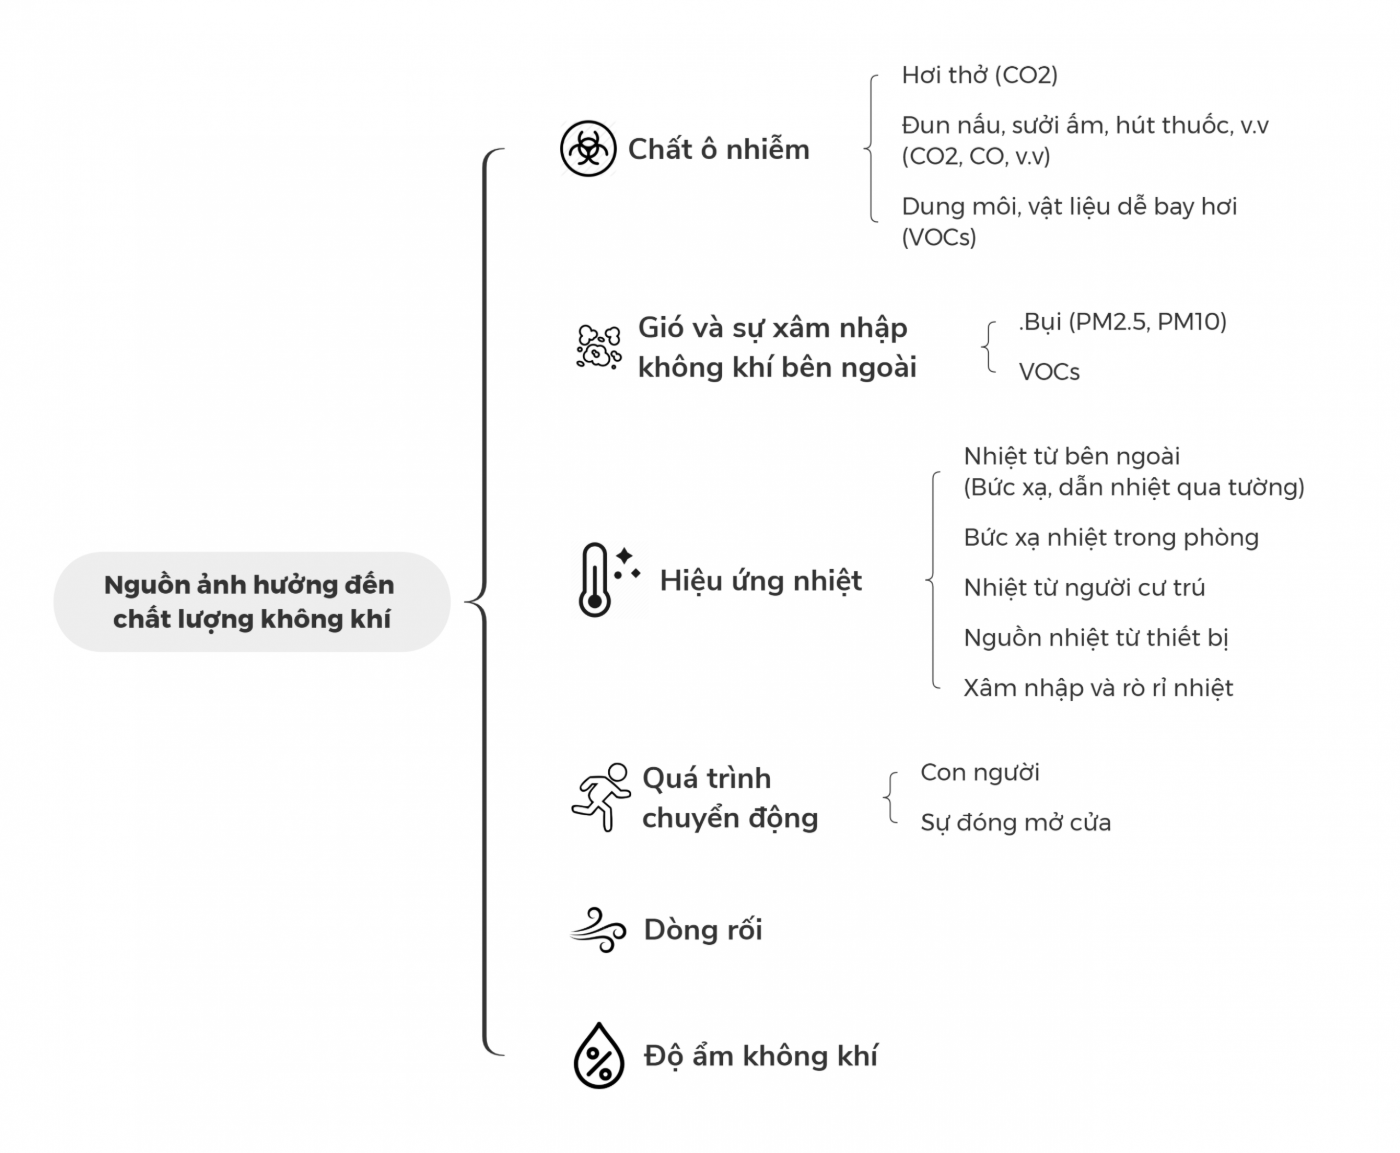
The pollutant sources that affect air quality [source]
Air quality has a large effect on people's health and productivity. In a sealed room — closed to keep the heat in during winter or to run the air conditioning in summer — indoor pollution is often worse than outdoors. A 2017 report by Vietnam's Ministry of Health found indoor PM2.5, PM10, bacteria and mold levels in Hanoi exceeding permitted limits by 1.1 to 3 times. World Health Organization figures put worldwide deaths from illness caused by air pollution at between 3.5 and 7 million a year [source]. Controlling indoor air pollution in Vietnam is therefore urgent [source]. Some of the health effects of indoor air pollution studied by the US Environmental Protection Agency (EPA) [source]:
- Irritation of the eyes, nose and throat.
- Headache, dizziness and fatigue.
- Respiratory disease, heart disease and cancer.
- Poisoning and death.
- And more.
Permitted pollutant limits are set in national standards such as DIN 1946 (Germany), EN 13779 (Europe), ANSI/ASHRAE 62.1 (USA) and TCVN 10736 (Vietnam). For green buildings, air quality is covered by standards such as LEED (USA) and Green Star (New Zealand). To make pollution levels easier to grasp, environmental agencies such as the US EPA publish an Air Quality Index (AQI). AQI, however, applies to outdoor air and covers six factors: CO, SO2, NO2, O3, PM2.5 and PM10. For indoor air, an Indoor Air Quality Index (IAQI) has been proposed, based on AQI with CO2 and VOCs added [source].
| Pollutant | GoodIAQI 100–76 | ModerateIAQI 75–51 | PoorIAQI 50–26 | HazardousIAQI 25–0 |
|---|---|---|---|---|
| CO2ppm | 340–600 | 601–1000 | 1001–1500 | 1501–5000 |
| COppm | 0.0–1.7 | 1.8–8.7 | 8.8–10.0 | 10.1–50.0 |
| NO2ppm | 0.0–0.021 | 0.022–0.08 | 0.09–0.17 | 0.18–5.0 |
| O3ppm | 0.0–0.025 | 0.026–0.05 | 0.051–0.075 | 0.076–0.10 |
| PM10µg/m³ | 0.0–0.020 | 0.021–0.150 | 0.151–0.180 | 0.181–0.600 |
| VOCppm | 0.0–0.087 | 0.088–0.261 | 0.263–0.430 | 0.440–3.00 |
| O2% | 23.5–20.9 | 20.8–19.5 | 19.4–12.0 | 11.9–10.0 |
The IAQI index and pollutant limits [source]
The role of CFD in assessing air quality
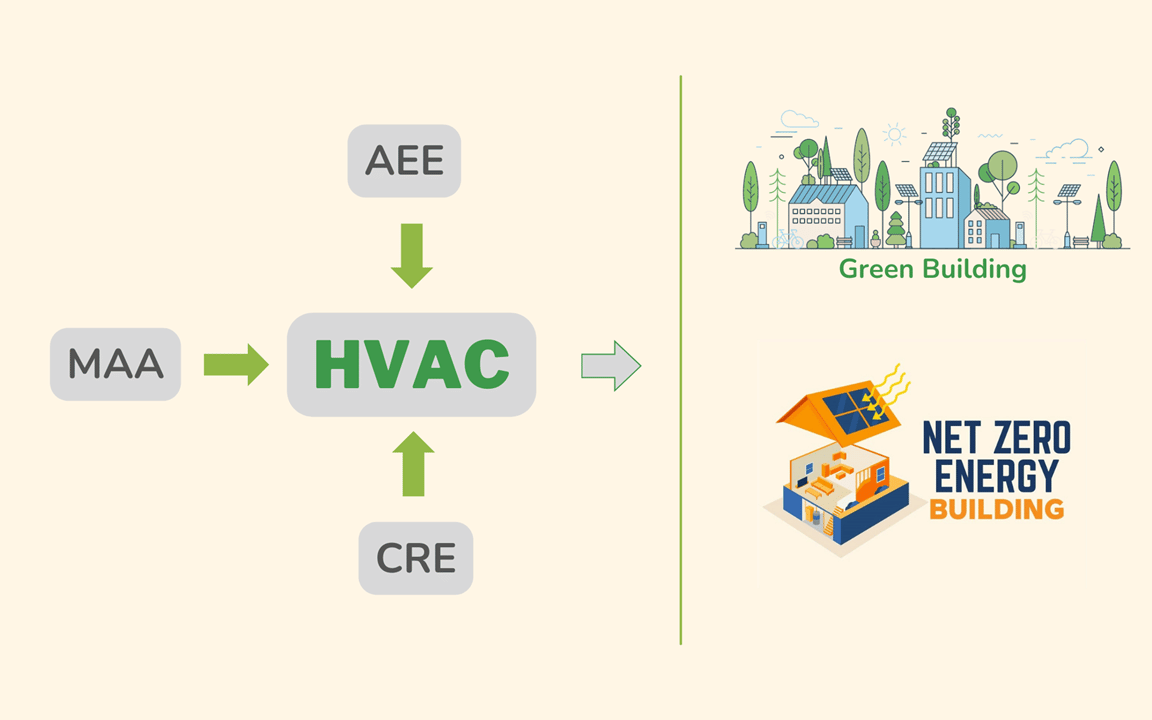
As earlier articles noted, HVAC design calculations rely on simple models based on handbooks and empirical formulas. That makes it hard to guarantee the resulting indoor air quality meets the standards — particularly green building and sustainability standards. In reality, changes in those factors can make the air quality worse. CFD has therefore been used as a support tool in HVAC design, with the combined workflow shown below. Some of the benefits:
- Straightforward verification of the original design (keeping physical testing to a minimum).
- Easy assessment of the factors that change indoor air quality, and testing of the fix.
- A convenient route to optimizing the HVAC system (better air quality, lower energy consumption) and the furniture layout.
- Building a database for the control system (IoT, for example).
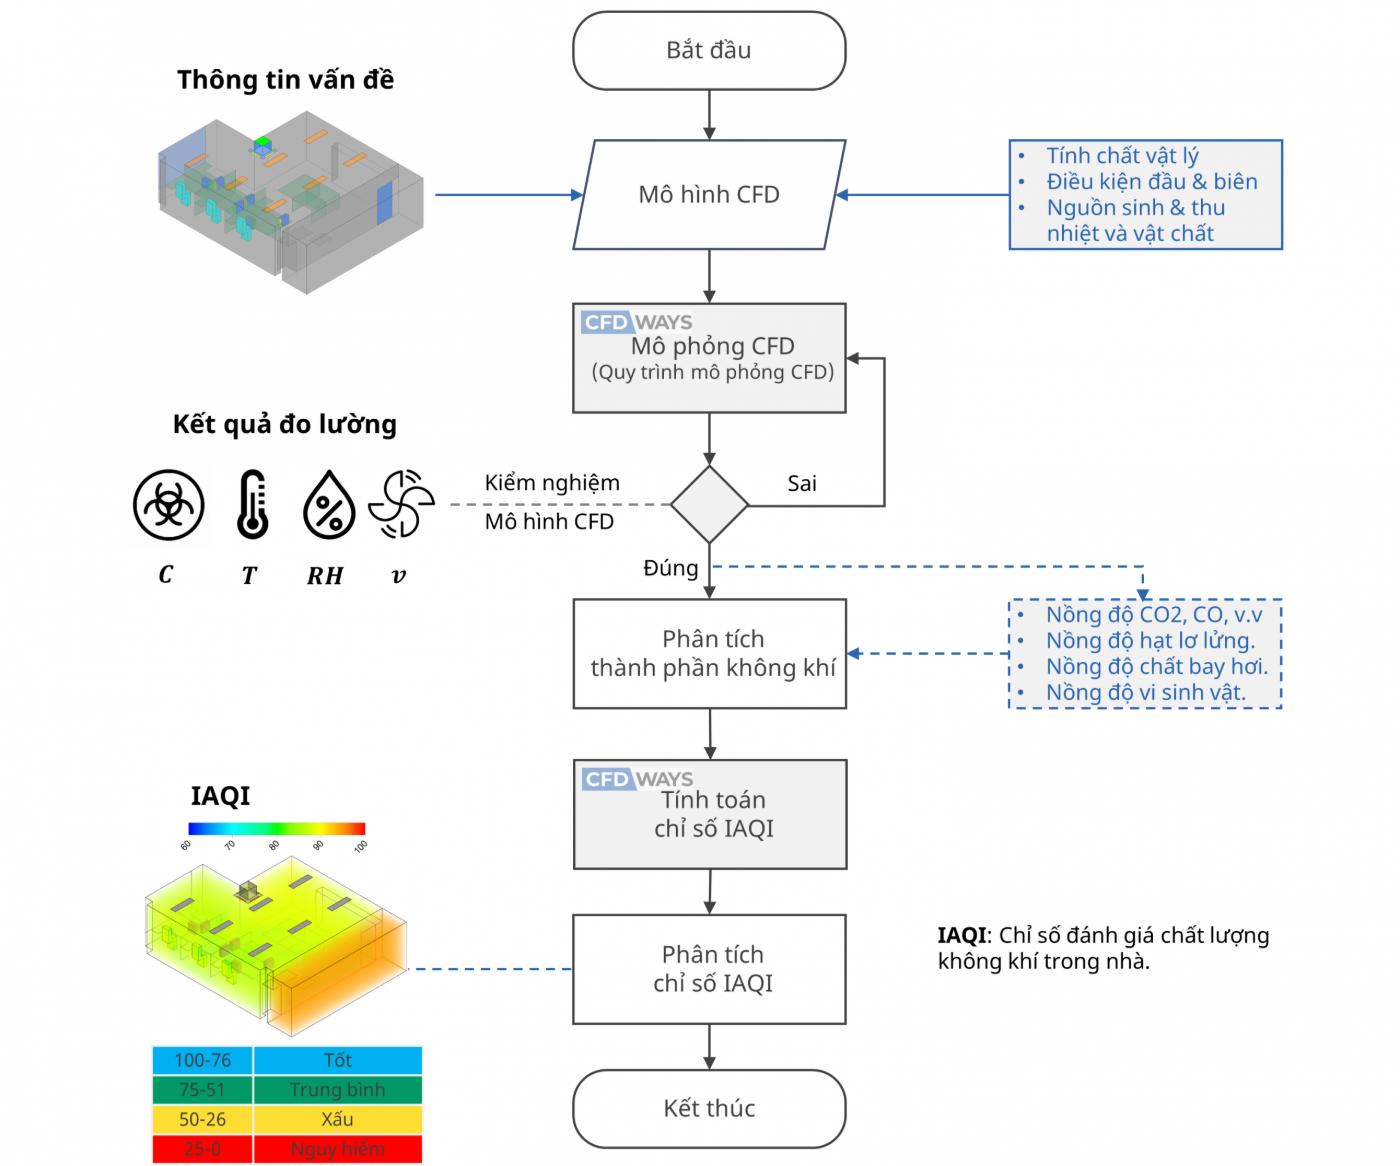
The workflow combining CFD with air quality assessment
CFD assessment of indoor air quality
To create an indoor environment that meets the air quality criteria, engineers have to compute and control the fresh air flow rate and its treatment sensibly [source]. CFD shows clearly how the factors affecting air quality are distributed, so engineers can analyze the problem in detail and arrive at an effective solution. The following simulation makes the benefits concrete.
The simulated case
The indoor space simulated is an office with an HVAC system already in operation, where the main pollution source is CO2 exhaled by the occupants. The 3D model of this office was introduced in the previous article.
The simulation runs with these fixed conditions:
- The outdoor temperature, and the initial temperature inside the office, are 30 ºC.
- The ceiling-mounted air conditioner runs at full capacity, with an air velocity of 3 m/s at 20 ºC.
- The heat flux from people is 55 W/m2 and from the lighting 18 W/m2.
- Each computer dissipates 100 W.
- The outdoor CO2 concentration, and the initial concentration inside the office, are 400 ppm.
- The windows are closed and sealed; the door is closed with a 1 cm gap at the floor.
Simulation results
In a sealed space with the air conditioner at full capacity, the air quality results (below) show CO2 distributed fairly evenly through the room, except close to the occupants. In the space directly in front of each person the CO2 concentration is higher than elsewhere (700 ppm) because exhaled breath contains around 5000 ppm. Overall the exhaled CO2 disperses quickly into the room air. The average concentration (487 ppm) keeps IAQI at a high level (400–600 ppm), except near the occupants where it is moderate (under TCVN 10736).
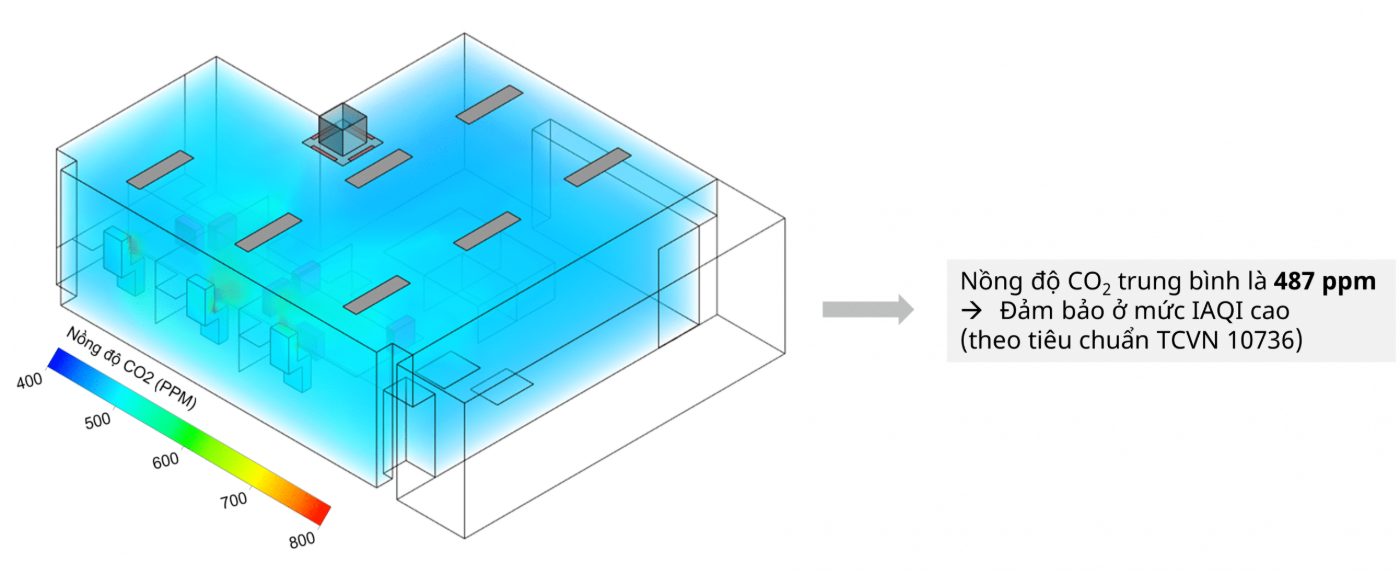
CO2 distribution after 80 minutes of cooling
In this simulation the IAQI is computed from a single pollutant, CO2. The results below show an average IAQI of 87.3, in the good range, and a moderate value near the occupants (60). Both are consistent with TCVN 10736, as analyzed above. In practice, IAQI is an aggregate assessment of all indoor pollutants (PM2.5, PM10 and so on).
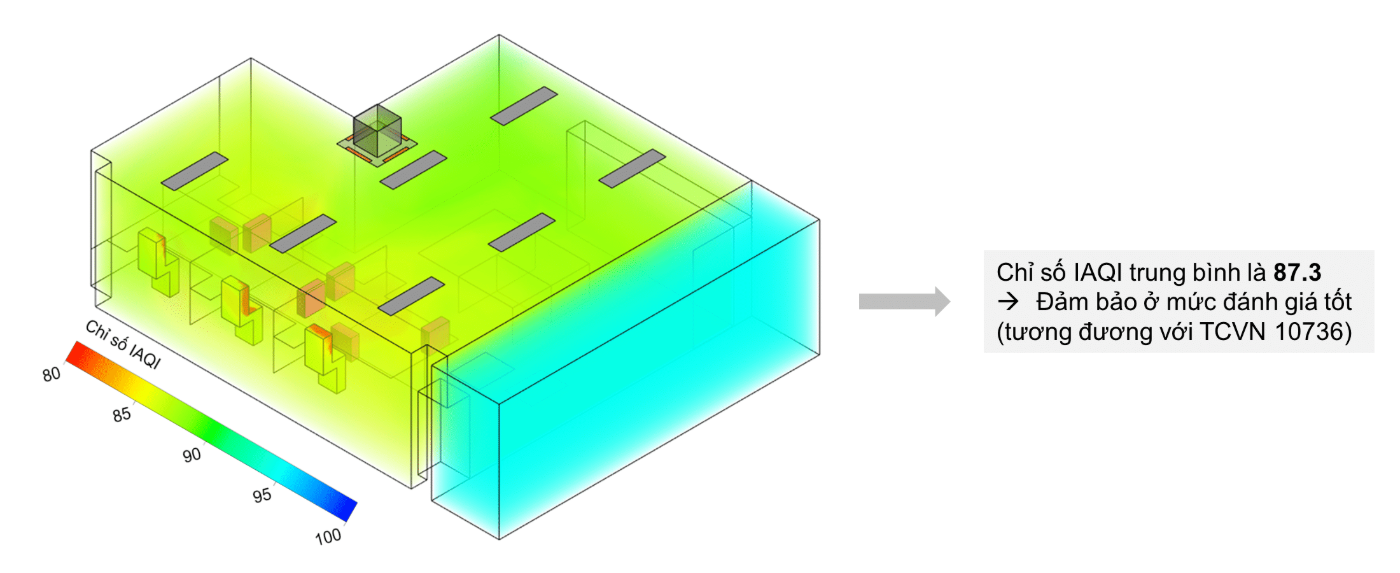
The indoor air quality index (IAQI) after 80 minutes of cooling
Conclusions from the simulation
The CFD results show that even with the HVAC system at full capacity, CO2 still concentrates in the space in front of each occupant. Over a longer period the concentration there could rise further. To keep IAQI at a good level, several fixes can be tested by simulation:
- Adding local ventilation (desk or wall fans, or a fresh air supply from outside).
- Using natural convection (opening windows to a sensible degree).
- Raising the air velocity or changing the deflector angle of the ceiling unit.
- Changing where the ceiling unit is mounted.
Testing these options is how the HVAC system is optimized, meeting the indoor air quality standard and economic targets at the same time.
Conclusion: CFD makes air quality assessment visual
With the help of CFD simulation, engineers get the clearest possible view of how the HVAC system will behave in operation right at the design stage — before construction — which makes verifying, improving and optimizing the system straightforward. Applying CFD to air quality saves time, cost and operating energy while raising the air quality achieved, helping the building meet green building criteria and move toward sustainability.
Follow the next part on assessing overall indoor environmental quality (the combined effect of thermal comfort and IAQI) in the series “CFD simulation in the HVAC field” on the CFDWAYS Blog.