Context & problem
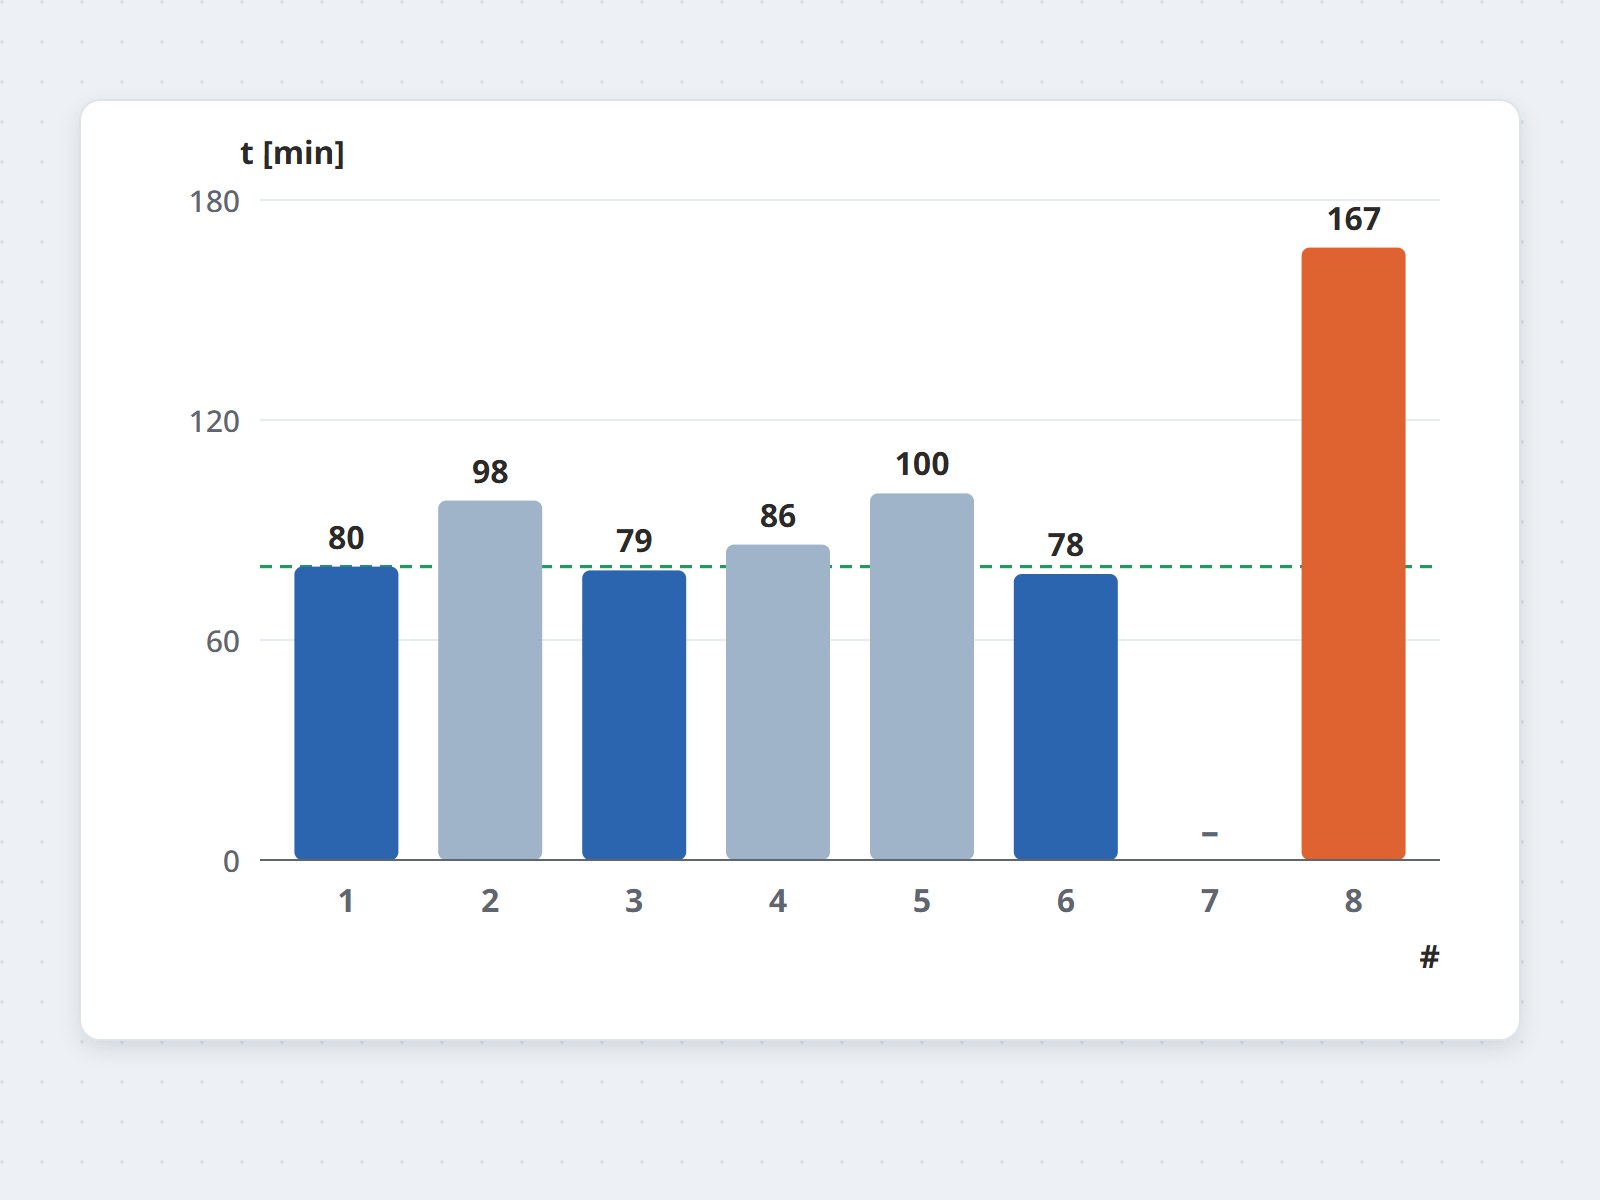
Measured on an ECO-2000 cabinet with trays of water, the time to pass the crystallization band (−1 to −5 °C)
ranged from 78 minutes on the best trays to 167 minutes on the slowest — more than double. The slowest tray sets the time for the whole freezing batch. Kobashi needed to establish the cold-air path in its 6-fan and 2-fan cabinets before improving them.
Approach
- 3D models of both cabinets (1.738 × 1.7 × 1.3 m): evaporator, fans, a rack of 4 columns × 18 rows of trays.
Identical comparison conditions: 13,645 m³/h total fan flow, −60 °C air off the evaporator, product at
−20 °C, steady heat transfer.
- A design air velocity of 5 m/s over the trays, from the air-blast freezing literature (Dempsey & Bansal
2012): above it, 20% more velocity shortens freezing by only 3% because conduction inside the product
dominates.
- Four quantitative KPIs: bypass ratio (air returning to the evaporator without crossing the
product), velocity and its uniformity at the product surface, Nusselt number and its uniformity between trays,
and uniformity of the evaporator suction.
Results
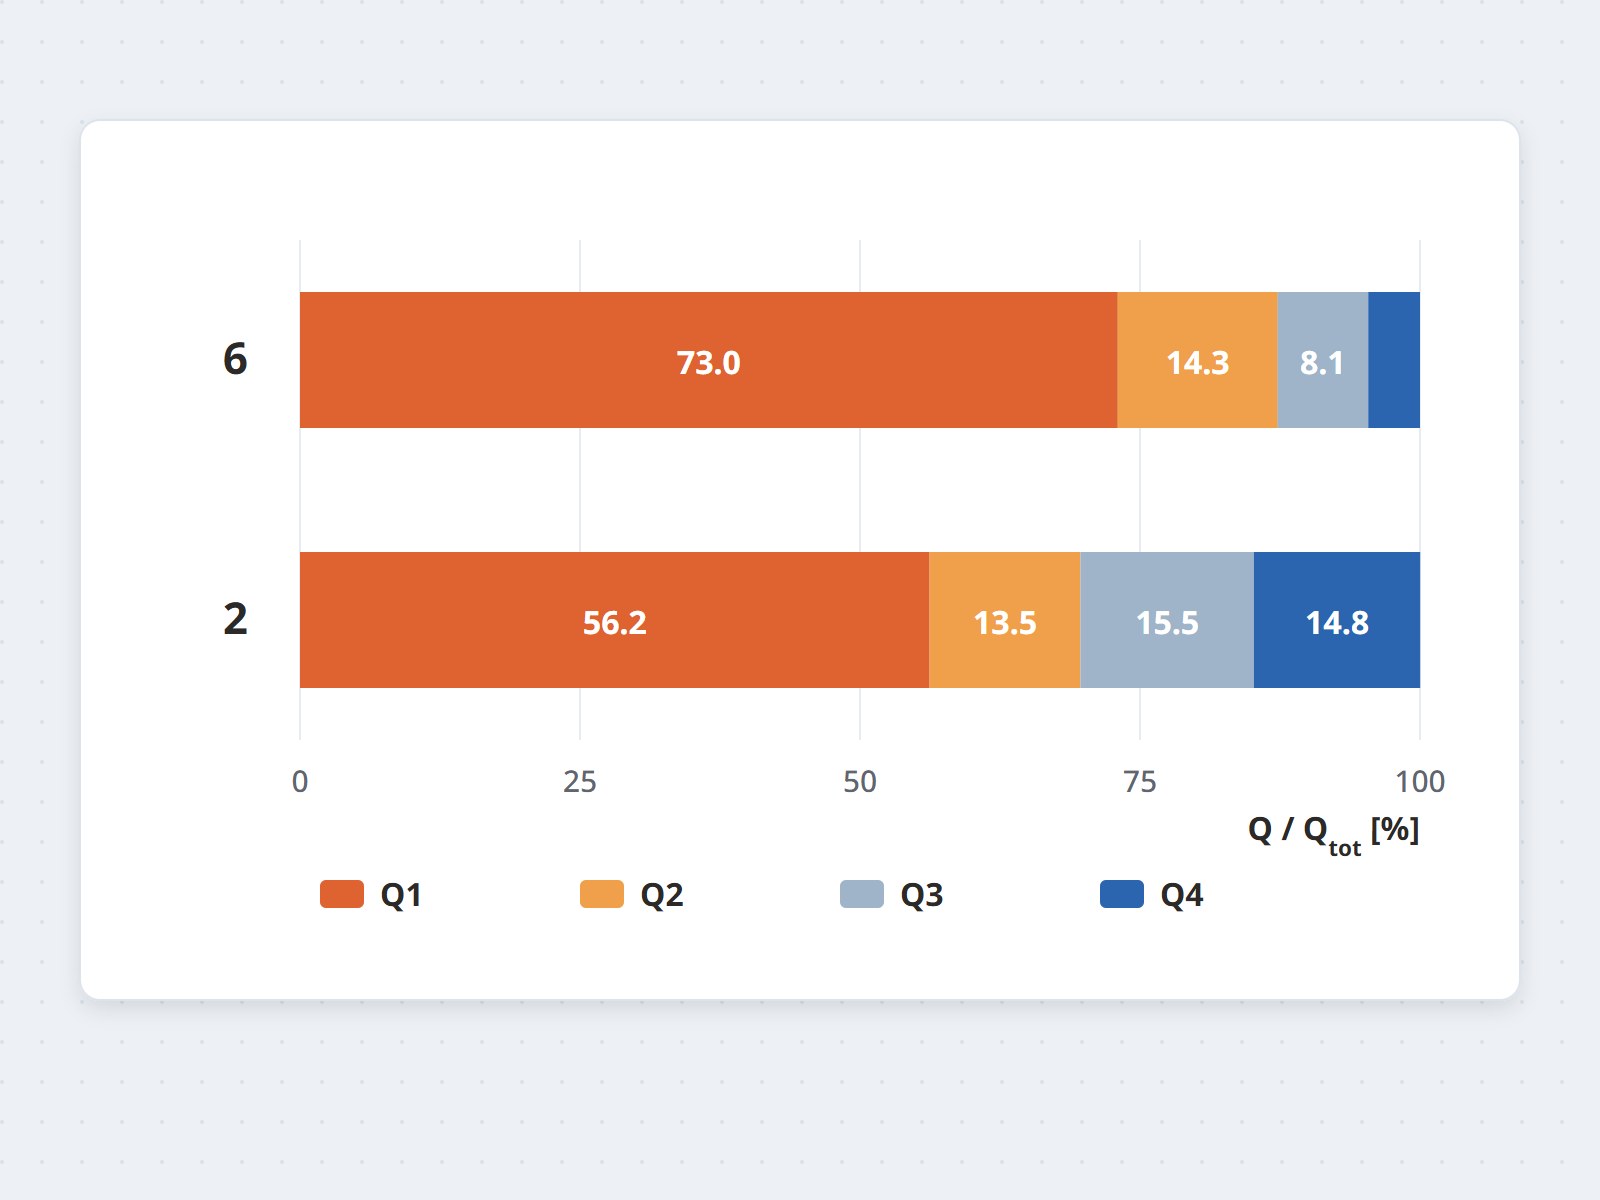
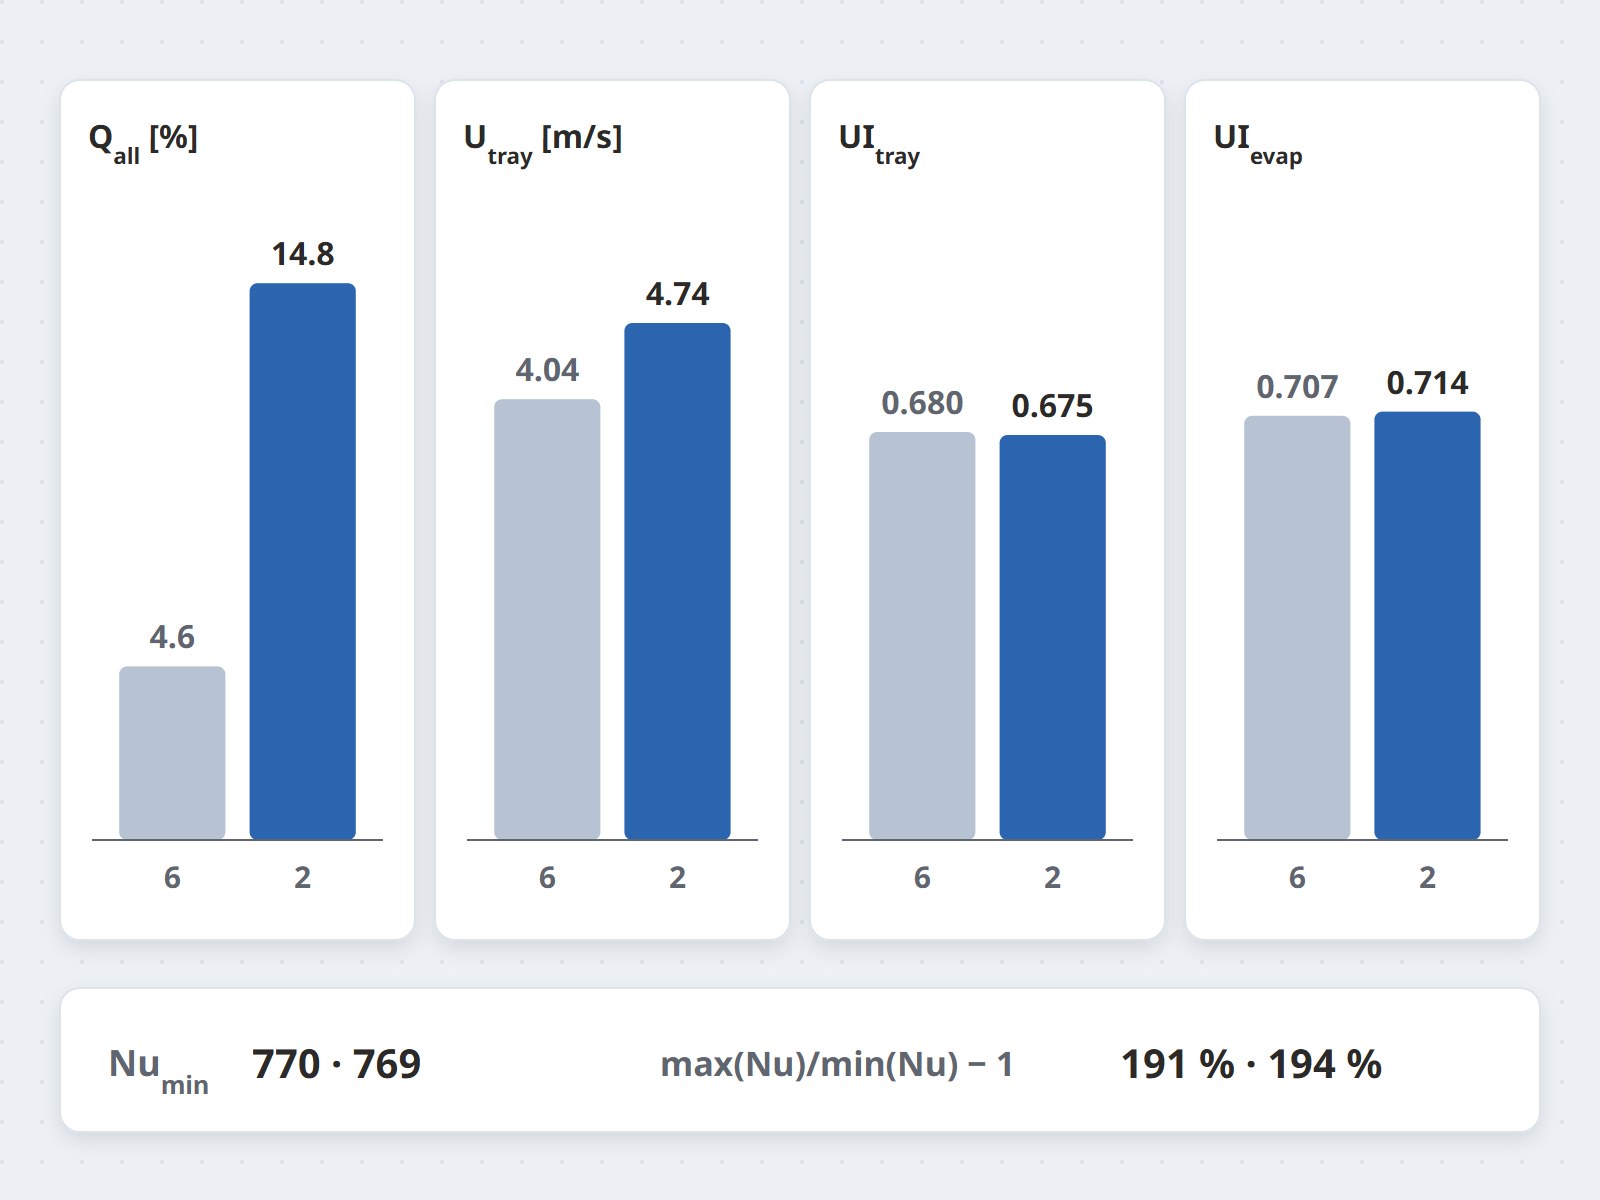
- Bypass dominates: 73% of the flow (6 fans) and 56% (2 fans) goes around the trays straight
back to the evaporator; only 4.6% and 14.8% passes through the whole product. Trays and rack resist the flow,
so the air takes the easier path.
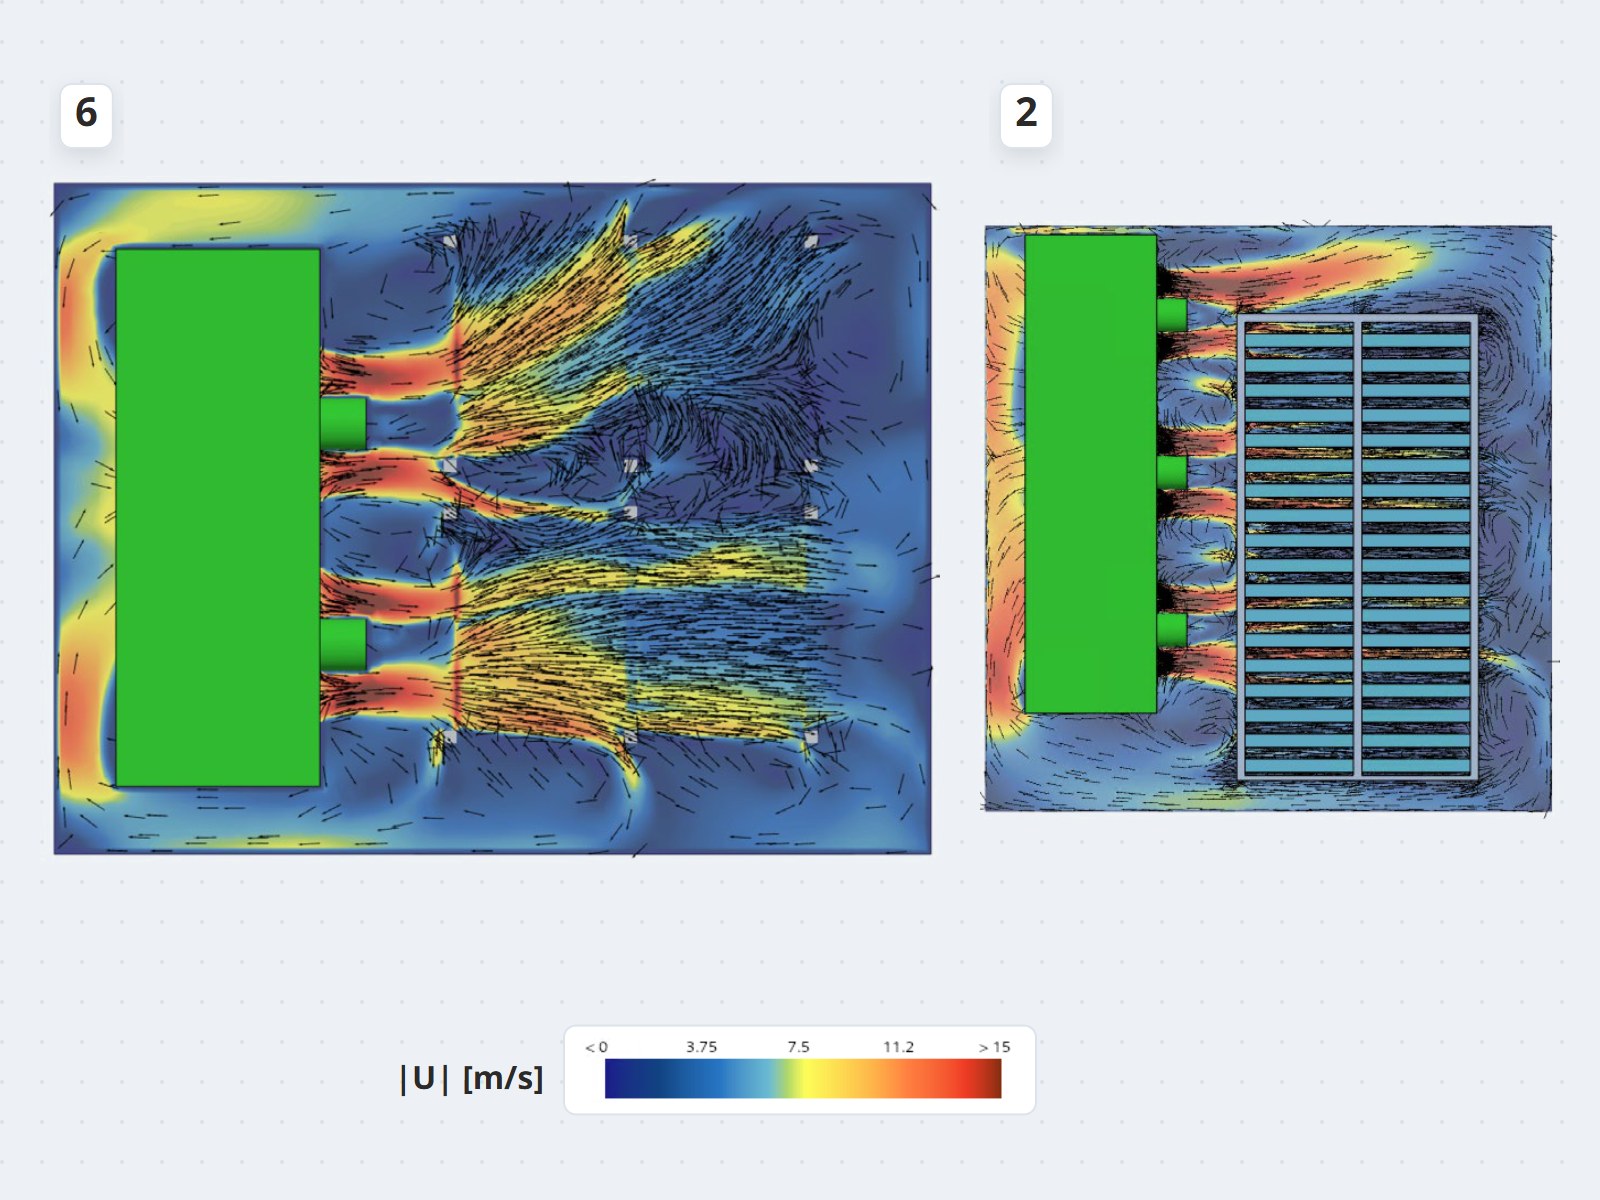
- Mean velocity at the product surface is 4.04 m/s (6 fans) and 4.74 m/s (2 fans), uniformity 0.68 in both;
the rear trays do not reach the 5 m/s design velocity. Narrow fan jets with the two fans far apart leave a dead
zone between them.
- Lowest Nusselt 770 and 769, spread between the highest and lowest tray 191% and 194%; the bottom trays and
the trays between two fans cool slowest. The 2-fan design is more even between front and rear trays (1.9%
against 8.8% deviation) and was chosen for further optimization.
- Evaporator suction is concentrated in the middle (uniformity 0.707 and 0.714), which risks uneven air
temperature off the fans.
Value
Three improvements target the quantified causes: baffles forcing the air through the product in one
direction, revised tray spacing, and adjusted fan flow. The KPI set and comparison conditions built here are
the common yardstick for every improvement option, set against the two existing cabinets.